업무 시스템 흐름
3-Tier · N-Tier
사용자 요청의 10계층 추적
Session 2 · Day 1 — 11:00 ~ 12:00 (60분)
아키텍처 패턴 · 계층별 컴포넌트 · 프로토콜·포트 · 응답시간 · 국내 실무 매핑
강사 박수현 · 🚀 젠아이랩스(GenAI Labs)
Session 2 — 회차 메타데이터
📋 세션 정보
- 슬롯: Day 1 · 11:00 ~ 12:00 (60분)
- 카테고리: 인프라 보강 ① — 업무 시스템 흐름
- 연계 워크시트: D1-3 「업무 시스템 흐름 분석」
- 선행 학습: Session 0 (TA 역할) · Session 1 (DC)
- 후속 학습: Session 2 (서버) · Session 3·4 (NW)
🎯 핵심 메시지
사용자 요청은 단순한 「클라이언트 → 서버」가 아니다. 평균 10단계를 통과하며, 각 단계마다 SPOF·보안·SLA가 결정된다.
🧭 학습 목표 (LO)
- 아키텍처 패턴 — 모놀리식 / 3-Tier / N-Tier / MSA 차이를 안다
- 3-Tier 계층 — Presentation · Business Logic · Data Layer 역할을 설명한다
- 요청 추적 — 사용자 클릭부터 DB 반영까지 10계층을 단계별로 그린다
- 계층별 표준 — 각 단계 프로토콜·포트·국내 실무 제품을 매핑한다
- 응답시간 분해 — SLA 2초를 10계층에 어떻게 배분하는지 안다
- 국내 실제 구성 — 대학·공공·금융의 흐름을 비교한다
Session 2 — 오늘의 흐름 (60분)
🗺️ Part A~C (전반부 · 30분)
- A. 아키텍처 패턴 큰 그림 — 모놀리식 → 3-Tier → N-Tier → MSA
- B. 3-Tier 상세 — Presentation · Logic · Data Layer 역할·제품
- C. 사용자 요청 10계층 추적 — Client → DNS → 보안 → LB → Web → APIGW → WAS → Cache → DB → SAN
🗺️ Part D~F (후반부 · 30분)
- D. N-Tier 확장 — 4·5·6 Tier · 마이크로서비스 분해
- E. 국내 실제 시스템 매핑 — 대학 학사 · 공공 그룹웨어 · 금융 코어
- F. 응답시간 분해 + 워크시트 D1-3 연계
Part A. 아키텍처 패턴 큰 그림
모놀리식 → 3-Tier → N-Tier → 마이크로서비스
4 슬라이드 · 약 7분
아키텍처 진화 — 30년 큰 그림
🕰️ 1990s · 모놀리식
- 단일 실행 파일 · 단일 서버
- Cobol·VB·C/S 클라이언트
- 국내 사례: 90년대 은행 코어 (HP9000·Tandem)
- 장점: 단순·빠른 응답 / 단점: 확장·이중화 불가
🕰️ 2000s · 3-Tier
- Web · WAS · DB 분리
- Java EE (WebLogic·JEUS) 표준
- 국내 사례: 2000년대 모든 SI 표준 (NEIS·정부24·증권 HTS)
- 장점: 계층별 확장 / 단점: WAS 병목
🕰️ 2010s · N-Tier + 캐시
-
- L7 LB · Reverse Proxy · Redis
- 국내 사례: 대형 포털·이커머스·금융 (네이버·카카오·KB)
- 장점: 무중단 배포 / 단점: 운영 복잡도
🕰️ 2020s · 마이크로서비스
- 서비스 단위 분리 · K8s · API Gateway
- 국내 사례: 카카오뱅크·토스·당근마켓
- 장점: 독립 배포·기술 다양성 / 단점: 분산 트레이싱 필수
🎨 이미지 프롬프트: "Editorial horizontal timeline illustration on dark navy #0f1722 background, divided into 4 sequential decade panels separated by thin teal vertical dividers. Panel 1 labeled '1990s · Monolith': a single large beige mainframe-style box with a green CRT terminal in front, labels 'COBOL · C/S · HP9000 · Tandem' floating around. Panel 2 labeled '2000s · 3-Tier': three vertically stacked rectangular boxes labeled top-to-bottom 'Web · WAS · DB' connected by glowing arrows, side note 'Java EE · WebLogic · JEUS · NEIS · Gov24'. Panel 3 labeled '2010s · N-Tier + Cache': five horizontally connected boxes 'LB → Web → WAS → Cache(Redis) → DB' with a small load-balancer icon at the front, side note 'Naver · Kakao · KB'. Panel 4 labeled '2020s · Microservices': a hexagonal cluster of 6-8 small service nodes orbiting a central Kubernetes wheel icon, each node a different teal-purple tint, side note 'KakaoBank · Toss · Daangn'. Bottom ribbon across all panels: '95% of Korean Universities & Public Sector still run 3-Tier — the standard, not the trend'. Teal #00b894 and purple #6c5ce7 accents, clean editorial illustration style, 16:9. CRITICAL: All visible text MUST be in English ONLY (no Korean characters). Each label appears EXACTLY ONCE."
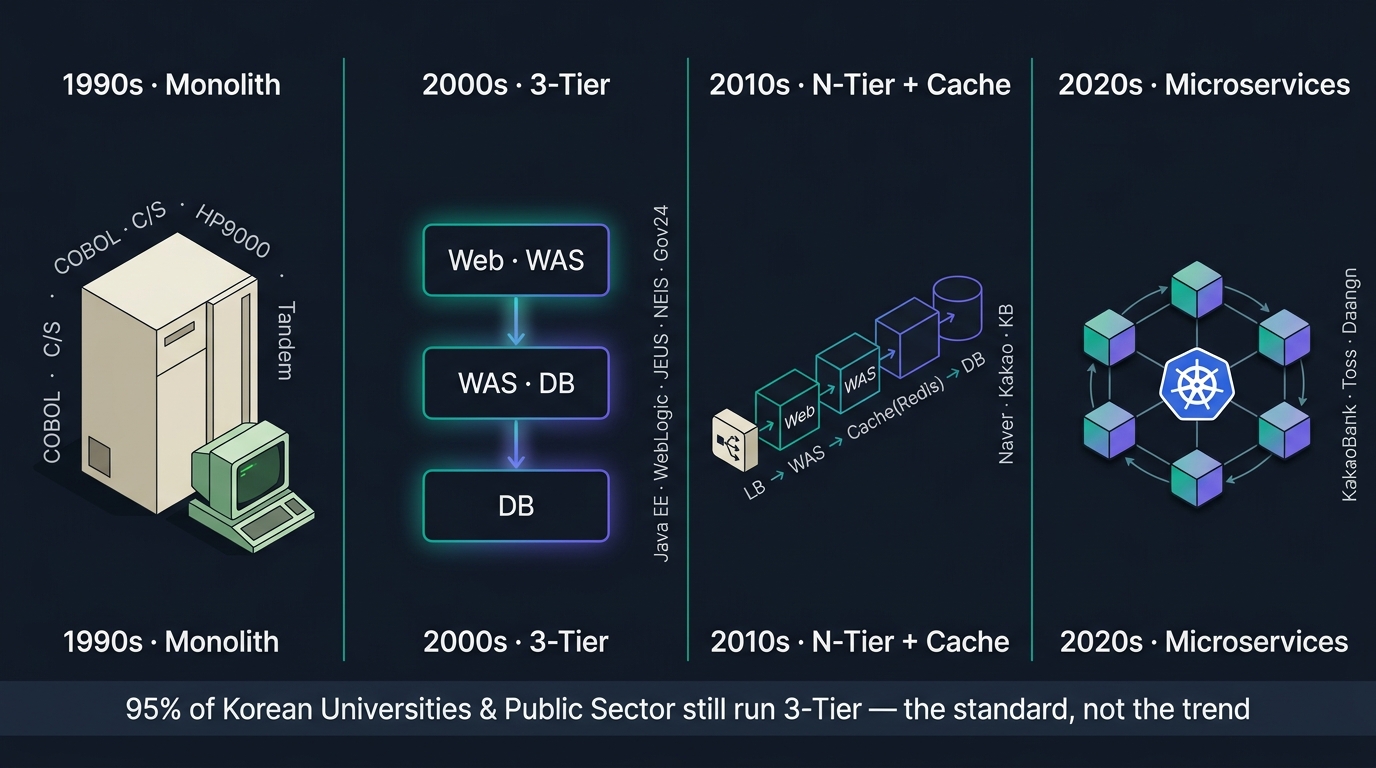
아키텍처 진화 — 30년 큰 그림
4가지 아키텍처 패턴 — 언제 어떤 것을 쓰는가?
| 패턴 | 구조 | 적합 시스템 | 국내 사례 |
|---|---|---|---|
| 모놀리식 | 단일 서버 + DB | 소규모 사내 시스템 (< 100명) | 부서별 회계 보조 |
| 3-Tier | Web · WAS · DB 분리 | 중대형 업무 (100~10,000명) | 대학 학사·정부24·코레일 |
| N-Tier | + LB · Cache · API GW | 대형 24x7 서비스 (10,000명+) | 카카오톡·네이버페이·증권 HTS |
| 마이크로서비스 | 서비스 단위 분리 + K8s | 초대형 글로벌 (수십만+) | 카카오뱅크·당근·토스·쿠팡 |
📌 TA 의사결정 기준 — 「현재 사용자 수」가 아니라 「3년 후 사용자·트랜잭션 증가율」 + 「운영 인력 수준」으로 결정.
Part B. 3-Tier 상세
Presentation · Business Logic · Data Layer
8 슬라이드 · 약 13분
3-Tier 큰 그림
┌──────────────────────────────────────────────────────────┐
│  ① Presentation Layer  (DMZ)                             │
│     Browser · Mobile App · 화면 렌더링·세션 표시          │
│     → Web Server (Nginx·Apache)                          │
├──────────────────────────────────────────────────────────┤
│  ② Business Logic Layer  (업무망)                        │
│     WAS — JEUS · WebLogic · Tomcat                        │
│     비즈니스 규칙·트랜잭션·외부 연계                       │
├──────────────────────────────────────────────────────────┤
│  ③ Data Layer  (업무망 깊숙이)                            │
│     DB — Oracle · Tibero · PostgreSQL                     │
│     Storage — SAN · NAS                                   │
│     영구 저장·트랜잭션 일관성·백업                         │
└──────────────────────────────────────────────────────────┘
🎨 이미지 프롬프트: "Editorial isometric architecture diagram on dark navy #0f1722 background showing the classic 3-Tier architecture. Three large vertically stacked horizontal floors connected by glowing teal arrows pointing downward (one-way). TOP FLOOR labeled 'Presentation Layer · DMZ Zone' (teal tint): a desktop monitor and a smartphone on the left, both connected via thin lines to a tall server rack labeled 'Web Server · Nginx · Apache'. MIDDLE FLOOR labeled 'Business Logic Layer · Internal Net' (purple tint): three server racks side by side labeled 'WAS · JEUS · WebLogic · Tomcat' with small gears floating around them representing transactions. BOTTOM FLOOR labeled 'Data Layer · Deep Internal' (orange tint): a cylindrical database icon labeled 'Oracle · Tibero · PostgreSQL' next to a storage array labeled 'SAN · NAS'. A vertical red 'ONE-WAY ONLY' arrow on the right side of all 3 floors showing direction. A red X mark blocking any arrow going from bottom to top, with a label 'NO direct back-channel'. Clean editorial illustration style, teal #00b894 and purple #6c5ce7 accents, 16:9. CRITICAL: All visible text MUST be in English ONLY. Each label appears EXACTLY ONCE."
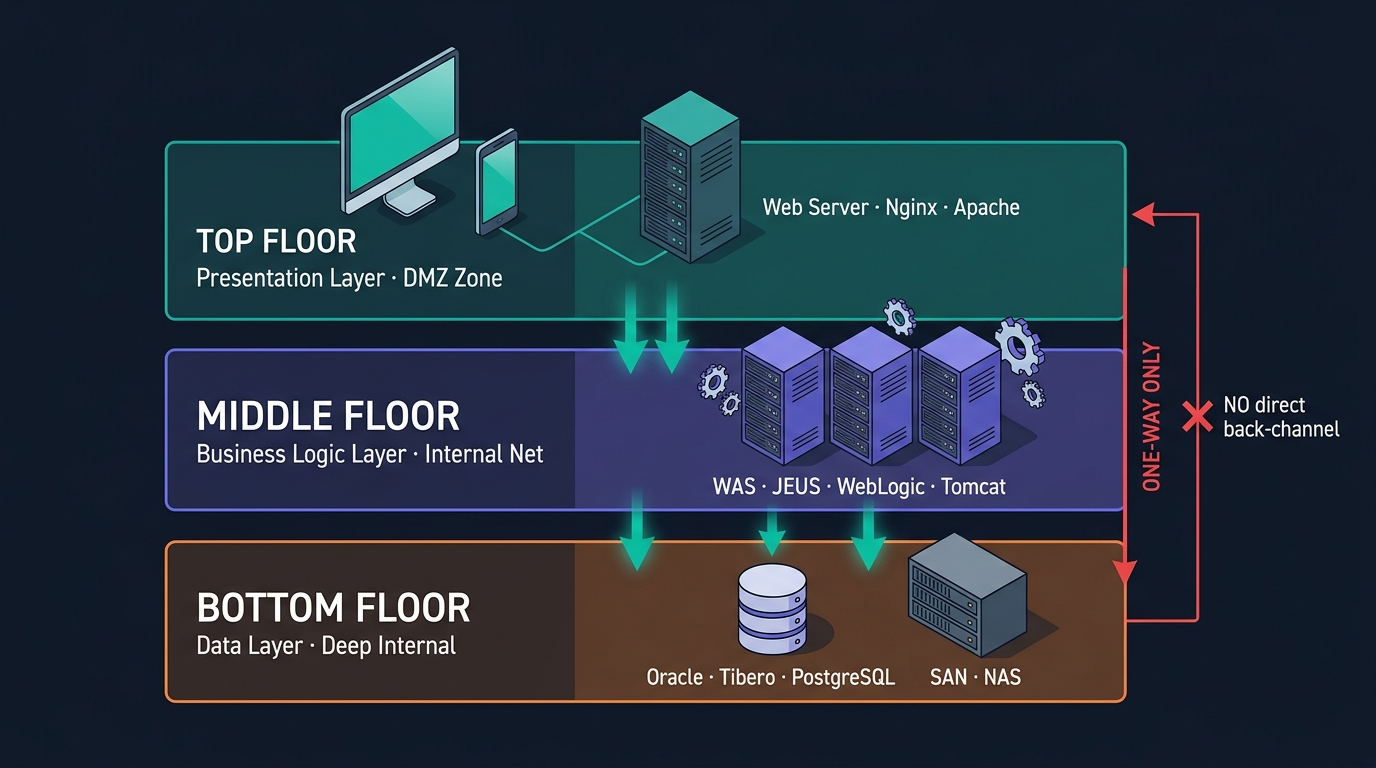
3-Tier 큰 그림
① Presentation Layer — Web Server
🎨 역할
- 정적 컨텐츠 제공 (HTML·CSS·JS·이미지)
- TLS 종단 (HTTPS → HTTP 변환)
- 세션 쿠키 보관 위치
- WAS로 요청 프록시 (Reverse Proxy)
- 간단한 압축·캐시·인증 검사
📦 국내 표준 제품
- Nginx (95% 점유 · OSS)
- Apache HTTP Server (구형 시스템)
- TmaxSoft WebtoB (국내 상용 · KCMVP 검증)
- IIS (Windows 환경)
🌐 표준 프로토콜·포트
- HTTPS / TCP 443 (외부)
- HTTP / TCP 80 (내부)
- AJP / TCP 8009 (WAS 연계 · 옛 방식)
- HTTP / TCP 8080·8443 (WAS 연계 · 현재)
🔐 보안 요구
- ISMS-P 2.6.1 — DMZ 배치 필수
- TLS 1.2 이상 — TLS 1.0/1.1 차단
- HSTS 헤더 적용 권장
- X-Forwarded-For 헤더로 원본 IP 보존
② Business Logic Layer — WAS (Web Application Server)
🧠 역할
- 비즈니스 규칙 실행 (수강신청·결재·송금)
- 트랜잭션 관리 (Begin·Commit·Rollback)
- 세션 관리 (Stateful)
- EJB·Spring·JPA 컨테이너
- 외부 시스템 연계 (REST·SOAP·MQ·FTP)
- 스레드 풀 관리 (동시 처리)
📦 국내 표준 제품
- TmaxSoft JEUS 8/9 (국내 1위 · 공공·금융)
- Oracle WebLogic 14c (대기업 · 통신·제조)
- Apache Tomcat 10 (OSS · 중소기업)
- JBoss EAP / WildFly (드물게)
🌐 프로토콜·포트
- HTTP/HTTPS 8080·8443 (수신)
- AJP 8009 (Web → WAS · 옛 방식)
- JNDI / RMI (분산 객체)
- JDBC 1521·5432 (DB 연결)
⚙️ 핵심 튜닝 파라미터
- 스레드 풀: 기본 200 → 운영 500~2,000
- JVM Heap: 4G~16G (대형 WAS)
- GC: G1GC (현재 표준) · ZGC (저지연)
- 세션 타임아웃: 30분 표준
💡 라이센스
- JEUS·WebLogic: 코어 단위 유상 (수천만~억)
- Tomcat: 무상 (OSS)
③ Data Layer — DB · Storage
🗄️ DB 역할
- ACID 트랜잭션 (Atomicity·Consistency·Isolation·Durability)
- 동시성 제어 (Lock·MVCC)
- 백업·복구 (RMAN·pg_dump)
- HA·복제 (DataGuard·Patroni·Replication)
- 암호화 (TDE·VKM·KCMVP)
📦 국내 표준 DBMS
- Oracle 19c / 23ai (대기업·금융·공공 1위)
- TmaxSoft Tibero 7 (국산 · 공공 우선)
- PostgreSQL 16 (OSS · 신규 시스템)
- Altibase HDB (국산 In-Memory)
- MS SQL Server (Windows 환경)
💾 Storage 역할
- 블록 I/O (DB Datafile·Redo Log)
- 파일 I/O (NFS·CIFS)
- Snapshot·Clone (Point-in-Time 복구)
- Tier 분리 (Hot SSD · Warm HDD · Cold Tape)
📦 국내 SAN/NAS 표준
- NetApp AFF · FAS (시장 1위)
- Dell PowerStore · PowerMax
- HPE Primera · Alletra
- Pure FlashArray (성장)
- Effix·Atto (국산 일부)
🔐 보안 요구
- 개인정보보호법 — 주민번호·계좌 AES-256 의무
- KCMVP 검증필 스토리지 (공공)
3-Tier — 망분리와 통신 경로 (KISA 가이드)
                  ┌─ 외부 인터넷 (Internet)
                  │
        ┌─────────▼──────────────────────────────────┐
        │  외부 방화벽 (NGFW · KCMVP)                 │
        └─────────┬──────────────────────────────────┘
                  │
                  ▼
        ┌──────────────────────────────────────────┐
        │  📍 DMZ                                  │
        │   ┌──────────────┐    ┌──────────────┐  │
        │   │  WAF / LB    │ →  │   Web Server │  │
        │   └──────────────┘    └──────────────┘  │
        └──────────────────────┬───────────────────┘
                               │ (단방향만 허용)
        ┌──────────────────────▼───────────────────┐
        │  내부 방화벽 (NGFW · 망간 통제)            │
        └──────────────────────┬───────────────────┘
                               ▼
        ┌──────────────────────────────────────────┐
        │  📍 업무망                                │
        │   ┌──────────────┐    ┌──────────────┐  │
        │   │     WAS      │ →  │      DB      │  │
        │   └──────────────┘    └──────────────┘  │
        │                                          │
        │              ┌──────────┐                │
        │              │ Storage  │                │
        │              └──────────┘                │
        └──────────────────────────────────────────┘
🇰🇷 KISA 망분리 가이드 핵심 규칙 - DMZ → 업무망: 단방향만 허용 (HTTP·DB Connection만) - 업무망 → DMZ: 차단 (역방향 금지) - 관리망 분리 (SSH·OOB)는 별도 망
Part C. 사용자 요청 10계층 추적
Client → DNS → 보안 → LB → Web → APIGW → WAS → Cache → DB → SAN
14 슬라이드 · 약 22분
사용자 요청 — 10계층 흐름 전체도
┌───────────────────────────────────────────────────────────────────┐
│                                                                   │
│  ① Client            ②           ③            ④           ⑤    │
│  ┌────────┐ HTTPS ┌─────┐ A    ┌──────┐    ┌──────┐     ┌─────┐ │
│  │Browser ├──────▶│ DNS ├─────▶│ AntiD├───▶│  WAF ├────▶│ LB  │ │
│  │ Mobile │ 443   │     │ IP   │ DDoS │    │      │     │ L4  │ │
│  └────────┘       └─────┘      └──────┘    └──────┘     └──┬──┘ │
│                                                            │     │
│                                                ┌───────────┘     │
│                                                ▼                 │
│  ⑩            ⑨        ⑧         ⑦      ⑥                     │
│  ┌──────┐  ┌────┐  ┌──────┐  ┌─────┐  ┌──────┐                 │
│  │ SAN  │◀─┤ DB │◀─┤Cache │◀─┤ WAS │◀─┤APIGW │                 │
│  │Storage│  │    │  │ Redis│  │     │  │      │                 │
│  └──────┘  └────┘  └──────┘  └─────┘  └──────┘                 │
│                                          ▲                       │
│                                          │                       │
│              ⑤b                          │                       │
│           ┌──────┐                       │                       │
│           │  Web │───────────────────────┘                       │
│           │Nginx │ HTTP 8080                                     │
│           └──────┘                                               │
└───────────────────────────────────────────────────────────────────┘
🎨 이미지 프롬프트: "Editorial horizontal flow diagram on dark navy #0f1722 background showing a 10-stage user request flow as a clean left-to-right pipeline that loops back. Top row left-to-right: stage 1 'Client' (icon: laptop+phone) → stage 2 'DNS' (icon: globe with address) → stage 3 'Anti-DDoS' (icon: shield with arrows blocked) → stage 4 'WAF' (icon: brick wall + filter) → stage 5 'Load Balancer L4/L7' (icon: traffic distributor). The pipeline then bends at stage 5 and continues right-to-left on the bottom row: stage 6 'Web Server · Nginx' (icon: web server rack) → stage 7 'API Gateway' (icon: gate with API tag) → stage 8 'WAS' (icon: server with gears) → stage 9 'Cache · Redis' (icon: lightning bolt cylinder) → stage 9b 'DB Primary+Replica' (icon: two linked database cylinders) → stage 10 'Storage · SAN/NAS' (icon: striped disk array). Each stage is a card with a teal #00b894 left border and purple #6c5ce7 connecting arrows. Tiny red warning dot on every stage with label 'SPOF risk' floating subtly. Top-right corner has a small badge 'End-to-end latency budget: 2 sec'. Clean editorial illustration style, 16:9. CRITICAL: All visible text MUST be in English ONLY. Each label appears EXACTLY ONCE."
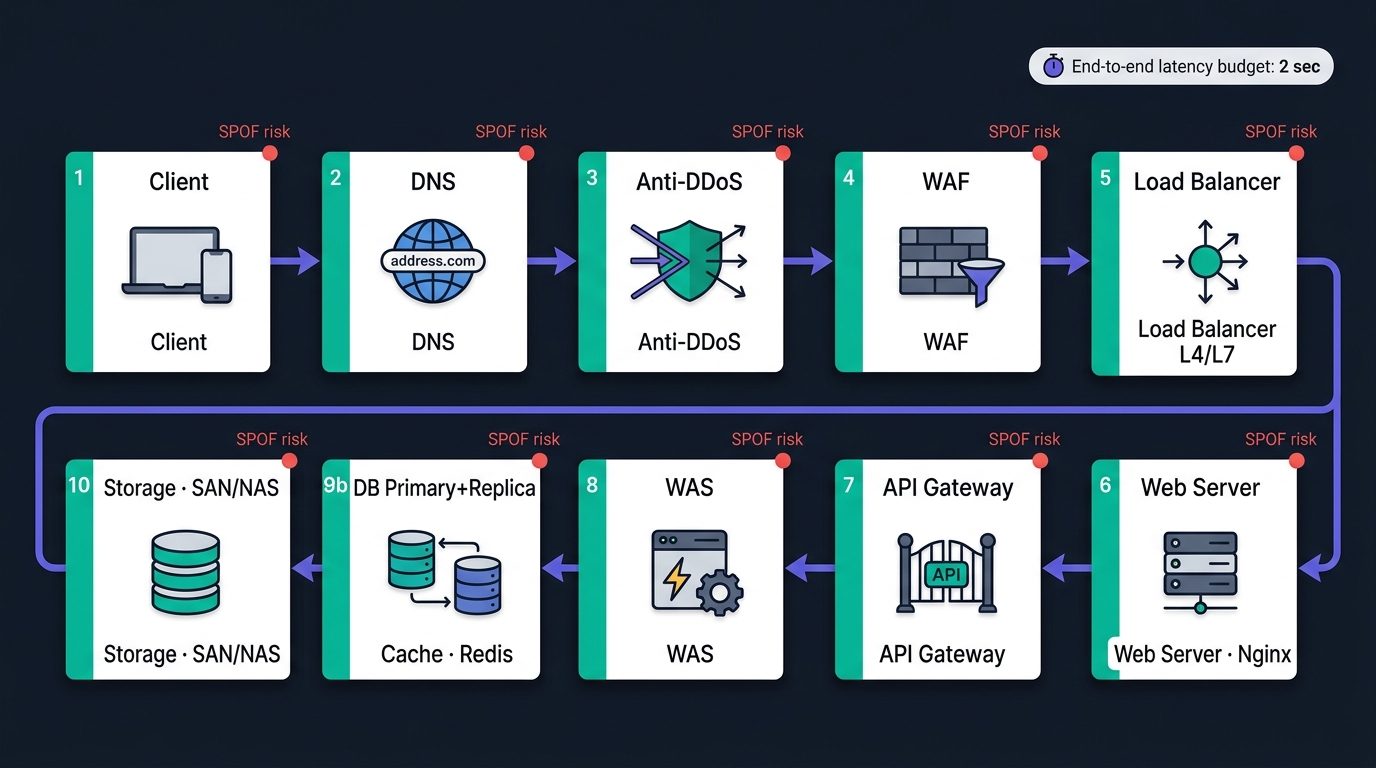
사용자 요청 — 10계층 흐름 전체도
① Client + ② DNS — 시작점
📱 ① Client
- 기능: 브라우저 렌더링 · TLS 1.3 세션 · Cookie 보관
- 국내 표준: Chrome 70% · Edge 20% · Safari 10%
- 모바일 앱: WebView 또는 Native (React Native·Flutter)
- 장애 시: 사용자 단에서 즉시 인지 → 콜센터 호출
- 응답시간 SLA: —
🌐 ② DNS
- 기능: 도메인 → IP 변환
- 프로토콜: DNS / UDP 53
- TTL: 60s~24h (Failover 속도 결정)
- 국내 DNS:
- 사내 BIND 9.x (대기업·공공)
- KISA DNS (.kr 도메인)
- 클라우드플레어·AWS Route 53 (외부)
- SPOF: DNS 1대 → 전체 도달 불가
- 이중화: Primary·Secondary + Geo-Anycast
- 응답시간 SLA: < 50ms
💡 TTL 전략 — 평상시 TTL 24h (캐시 효율). 변경 직전 TTL 60s로 단축 → 변경 → 다시 24h. DNS Failover 활용 사례 ★
③ Anti-DDoS + ④ WAF — 외부 보안 1·2차 방어
🛡️ ③ Anti-DDoS
- 차단 대상: SYN Flood·UDP Flood·ICMP Flood·DNS Amp
- 위치: 회선 직후 (최외곽)
- 국내 표준 제품:
- Radware DefensePro (시장 1위)
- A10 Thunder TPS
- 이글루코퍼레이션 · SK쉴더스 (서비스형)
- 방어 용량: 10Gbps~수 Tbps
- 응답시간 SLA: < 1ms (Bypass 모드)
🔐 ④ WAF (Web Application Firewall)
- 차단 대상: SQL Injection · XSS · CSRF · Bot · L7 공격
- 위치: DDoS 직후·LB 앞
- 국내 표준 제품 (CC/BMT 검증):
- Penta Security WAPPLES ★ (국내 WAF 점유율 1위, 공공 사실상 표준)
- 모니터랩 AIWAF (국내 클라우드 WAF 1위)
- F5 Advanced WAF i7800 (외산 참고)
- 응답시간 SLA: < 5ms
⑤ Load Balancer — L4 / L7 분산
⚖️ L4 LB (TCP/UDP)
- 알고리즘: Round-Robin · Least Conn · Weighted · Hash
- 세션 유지: Source IP Hash · Cookie
- 국내 표준:
- F5 BIG-IP LTM i5800·i7800 ★
- Citrix NetScaler
- A10 Thunder ADC
- HAProxy 2.x (OSS)
- 응답시간 SLA: < 1ms
🎯 L7 LB (HTTP/HTTPS)
- 추가 기능: URL 라우팅·Header 분석·SSL Termination
- 제품: Nginx Plus · HAProxy · F5 BIG-IP
🔄 이중화 패턴 (필수)
- Active-Standby (VRRP): 1대만 일하고 1대 대기
- Active-Active (Multi-Path): 둘 다 일함
- Cluster (3+ node): 정족수 기반
💡 SSL Termination 위치
- LB에서 종단 (성능 우수, 내부 평문)
- Web Server에서 종단 (안전, 부하 ↑)
- WAS까지 SSL 패스스루 (E2E 암호화, 복잡)
- 국내 표준: LB 종단 + 내부망 평문
⑥ Web Server — 정적 컨텐츠 + Reverse Proxy
🌐 역할
- 정적 컨텐츠 직접 제공: HTML·CSS·JS·이미지 (캐시)
- Reverse Proxy: 동적 요청을 WAS로 전달
- SSL Termination: LB에서 못 끝낸 SSL 처리
- 압축: gzip·brotli
- Rate Limit: IP·세션별 초당 요청 제한
- 로깅: Access Log·Error Log
📦 국내 표준
- Nginx 1.24 (95% 점유)
- Apache HTTP Server 2.4 (구형)
- TmaxSoft WebtoB (국산 · 공공)
🌐 프로토콜·포트
- 외부: HTTPS 443
- LB로부터: HTTP 80
- WAS로: HTTP 8080 / AJP 8009
⚙️ 핵심 설정 (Nginx 예시)
worker_processes auto;
worker_connections 4096;
proxy_pass http://was_upstream;
proxy_set_header X-Forwarded-For $remote_addr;
proxy_read_timeout 30s;
gzip on;
limit_req zone=login burst=10;
- 응답시간 SLA: < 10ms (정적) · < 100ms (프록시)
⑦ API Gateway — 인증·라우팅·통제
🚪 역할
- 인증: OAuth 2.0 · JWT · API Key 검증
- 라우팅: URL → 마이크로서비스 매핑
- Rate Limit: 사용자·앱별 호출 제한
- 로깅·감사: 모든 API 호출 기록
- 변환: 프로토콜·페이로드 변환 (REST↔SOAP)
📦 국내 표준
- Kong Gateway 3.x ★ (OSS·OEM)
- Spring Cloud Gateway (Java 기반)
- Apigee (Google · 대기업)
- Penta Security iSIGN+ (국내 · KCMVP)
- TmaxSoft API Gateway
🔐 인증 방식
- OAuth 2.0 — 외부 사용자 (Google·Naver Login)
- JWT (JSON Web Token) — 무상태 인증
- OIDC — OAuth + Identity
- mTLS — 시스템 간 상호 인증
- 국내 사례: 공공포털 → 정부24 본인인증 연계
💡 언제 도입하는가?
- 마이크로서비스 분리 시작
- 외부 API 공개 (Open API)
- 모바일 앱·웹·파트너 통합 진입점
⑧ WAS — 비즈니스 로직의 심장
🎯 처리 흐름
- HTTP 요청 수신 (스레드 풀에서 워커 할당)
- Filter·Interceptor (인증·권한·로깅)
- Controller (URL 매핑)
- Service Layer (비즈니스 로직)
- Transaction Begin
- Repository → JDBC → DB
- Transaction Commit / Rollback
- JSON·HTML 응답 생성
- HTTP 응답 송신
⚙️ 성능 결정 변수
- 스레드 풀 크기: 동시 사용자 = 스레드 수
- JVM Heap: 4G(소)~32G(대)
- GC 알고리즘: G1GC 표준
- DB 커넥션 풀: HikariCP 10~50 conn
- 세션 저장소: 내부(Sticky) vs Redis
📊 모니터링 도구 (국내 표준)
- Jennifer ★ (제니퍼소프트 · 대기업·공공 1위)
- Pinpoint (네이버 OSS)
- Scouter (LG CNS OSS)
- APMnow (한국SI 일부)
- 응답시간 SLA: < 80ms
⑨ Cache — DB 부하 분산
🎯 역할
- 자주 읽는 데이터 캐싱 (상품 목록·메뉴)
- 세션 저장소 (WAS 세션 외부화)
- 임시 데이터 (장바구니·OTP)
- Pub/Sub (실시간 이벤트)
📦 국내 표준
- Redis 7.x ★ (90% 점유)
- Memcached (단순 KV)
- Apache Ignite (분산 그리드·드물게)
🔄 이중화
- Redis Sentinel (Master-Replica + 자동 Failover)
- Redis Cluster (Shard + Replica)
🌐 프로토콜·포트
- TCP 6379 (Redis)
- TCP 11211 (Memcached)
💡 캐시 전략 (Cache Pattern)
- Cache-Aside (Lazy Loading): 가장 흔함
- Read-Through: 캐시가 자동 로드
- Write-Through: 쓰기 시 캐시 갱신
- Write-Behind: 비동기 쓰기 (위험)
⚠️ 캐시 함정
- Cache Stampede: 만료 동시 발생 → DB 폭주
- 해결: 만료 시간 분산 (jitter)
- 응답시간 SLA: < 1ms
⑨ DB — 트랜잭션 최종 처리 지점
🗄️ Primary DB 역할
- DDL/DML 실행: CREATE·INSERT·UPDATE·DELETE
- 트랜잭션 관리: Commit·Rollback·Lock
- 무결성 보장: PK·FK·CHECK·NOT NULL
- 인덱스 유지: B-Tree·Hash
- 백업 소스: RMAN·pg_basebackup
🌐 프로토콜·포트
- Oracle: TCP 1521
- PostgreSQL: TCP 5432
- Tibero: TCP 8629
- MySQL: TCP 3306
- MS SQL: TCP 1433
🔄 이중화 (필수)
- Active-Standby:
- Oracle DataGuard (Sync·Async)
- PostgreSQL Streaming Replication
- Patroni + etcd (자동 Failover)
- Active-Active:
- Oracle RAC (Real Application Cluster)
- Tibero TAC
- PostgreSQL BDR (드물게)
💰 라이센스
- Oracle 19c: CPU 코어당 약 6만$ (Enterprise)
- Tibero 7: 약 1/3 수준
- PostgreSQL: 무상
- 응답시간 SLA: < 30ms (OLTP)
⑩ Storage — 데이터를 영속적으로 보관하는 계층
💾 SAN (Block I/O)
- 용도: DB Datafile · Redo Log · VM 부팅 디스크
- 프로토콜: FC 16G/32G · iSCSI 10G/25G · NVMe-oF
- 국내 표준 제품:
- NetApp AFF A800 ★
- Dell PowerStore 5000
- HPE Primera A630
- Pure FlashArray //X
- 응답시간 SLA: < 2ms
📁 NAS (File I/O)
- 용도: 그룹웨어 첨부 · 공유 파일
- 프로토콜: NFS v3/v4 · CIFS/SMB
- 응답시간: < 10ms
🔧 핵심 설정
- RAID 레벨: RAID-10 (DB) · RAID-6 (NAS)
- Multipath: ALUA · Round-Robin · 2~4 path
- Snapshot: 시간 단위 · 일 보관 7일
- Tier: Hot SSD · Warm HDD · Cold Tape
🔐 보안
- 암호화: NSE (Self-Encrypting Drive)
- AES-256 (개인정보보호법 요구)
- KCMVP 검증 우선
📊 모니터링
- NetApp ONTAP System Manager
- Dell CloudIQ
- HPE InfoSight
Part D. N-Tier 확장
4·5·6 Tier · 마이크로서비스 분해
6 슬라이드 · 약 10분
N-Tier — 3-Tier에서 어떻게 확장하는가?
4-Tier (+ Cache Tier)
Client → Web → WAS → Cache → DB
- 추가: Redis·Memcached
- DB 부하 30~50% 감소
- 적용 시점: 동시 1,000명 이상
5-Tier (+ API Gateway)
Client → Web → APIGW → WAS → Cache → DB
- 추가: Kong·Apigee
- MSA 진입점 + 인증·라우팅
- 적용 시점: 모바일·외부 API 공개
6-Tier (+ Service Mesh)
Web → APIGW → [Istio Mesh] → MS → Cache → DB
- 추가: Service Mesh (Istio·Linkerd)
- mTLS·트래픽 분배·관찰성
- 적용 시점: 마이크로서비스 50개+
💡 한국 현실
- 95% 시스템 — 3-Tier 또는 4-Tier
- 5% 대형 시스템 — 5-Tier
- 1% 미만 — 6-Tier (카카오·네이버·토스 일부)
🎨 이미지 프롬프트: "Editorial vertical stacking illustration on dark navy #0f1722 background showing the evolution from 3-Tier to 6-Tier as four horizontal rows, each row a complete pipeline of connected boxes. ROW 1 labeled '3-Tier · baseline · 95% of KR systems': three boxes 'Web → WAS → DB' with thin teal arrows. ROW 2 labeled '4-Tier · +Cache · 1000+ concurrent users': four boxes 'Web → WAS → Cache(Redis) → DB' with the new 'Cache' box highlighted in glowing teal. ROW 3 labeled '5-Tier · +API GW · public API era': five boxes 'Web → API GW(Kong) → WAS → Cache → DB' with 'API GW' highlighted in glowing purple. ROW 4 labeled '6-Tier · +Service Mesh · 50+ microservices': six boxes 'Web → API GW → Service Mesh(Istio) → MS Cluster → Cache → DB' with 'Service Mesh' highlighted in glowing orange and a small Istio honeycomb icon. Right-edge stacked counter ribbon showing '3T: 95% · 4T: included · 5T: 5% · 6T: <1%' of Korean systems. Tiny KR brand silhouettes next to relevant rows: 'Kakao · Naver · Toss' next to 6-Tier. Clean editorial illustration style, teal #00b894 and purple #6c5ce7 accents, 16:9. CRITICAL: All visible text MUST be in English ONLY. Each label appears EXACTLY ONCE."
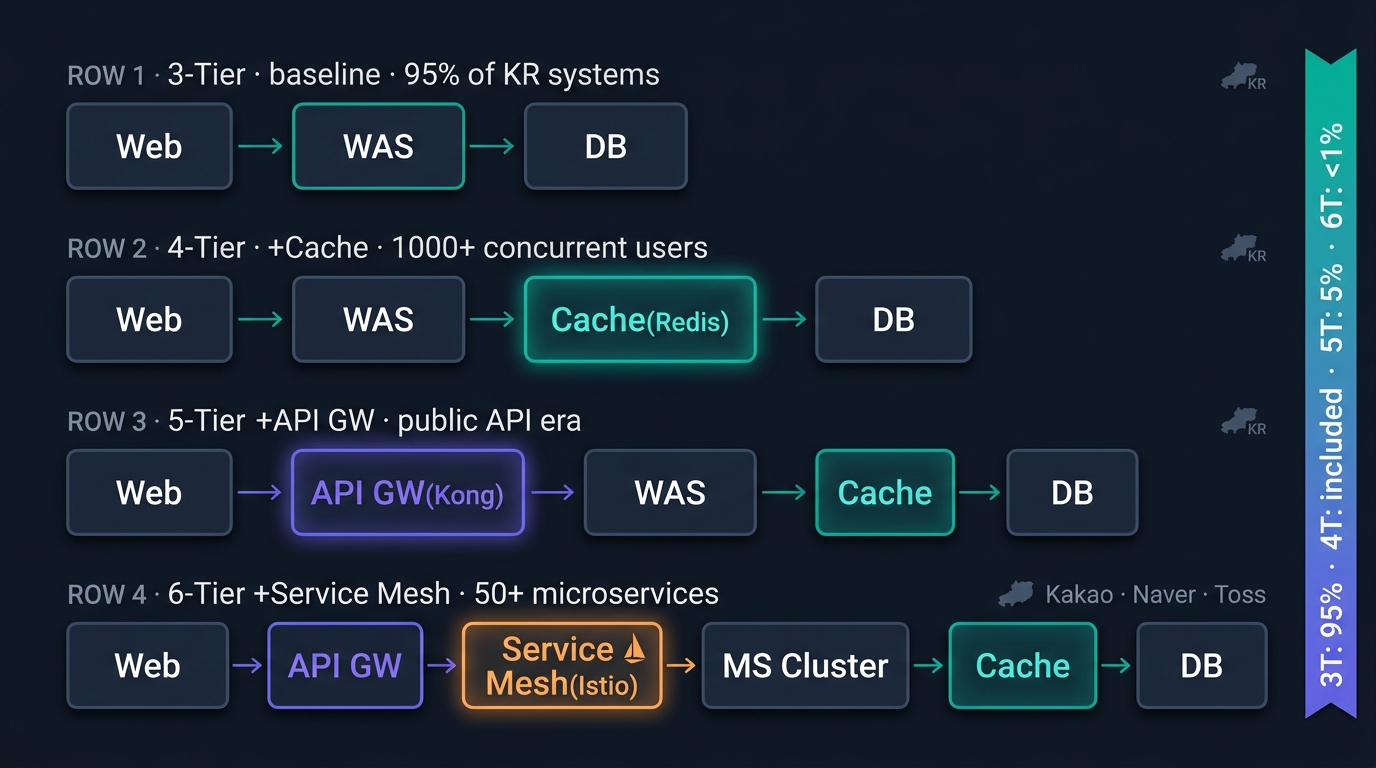
N-Tier — 3-Tier에서 어떻게 확장하는가?
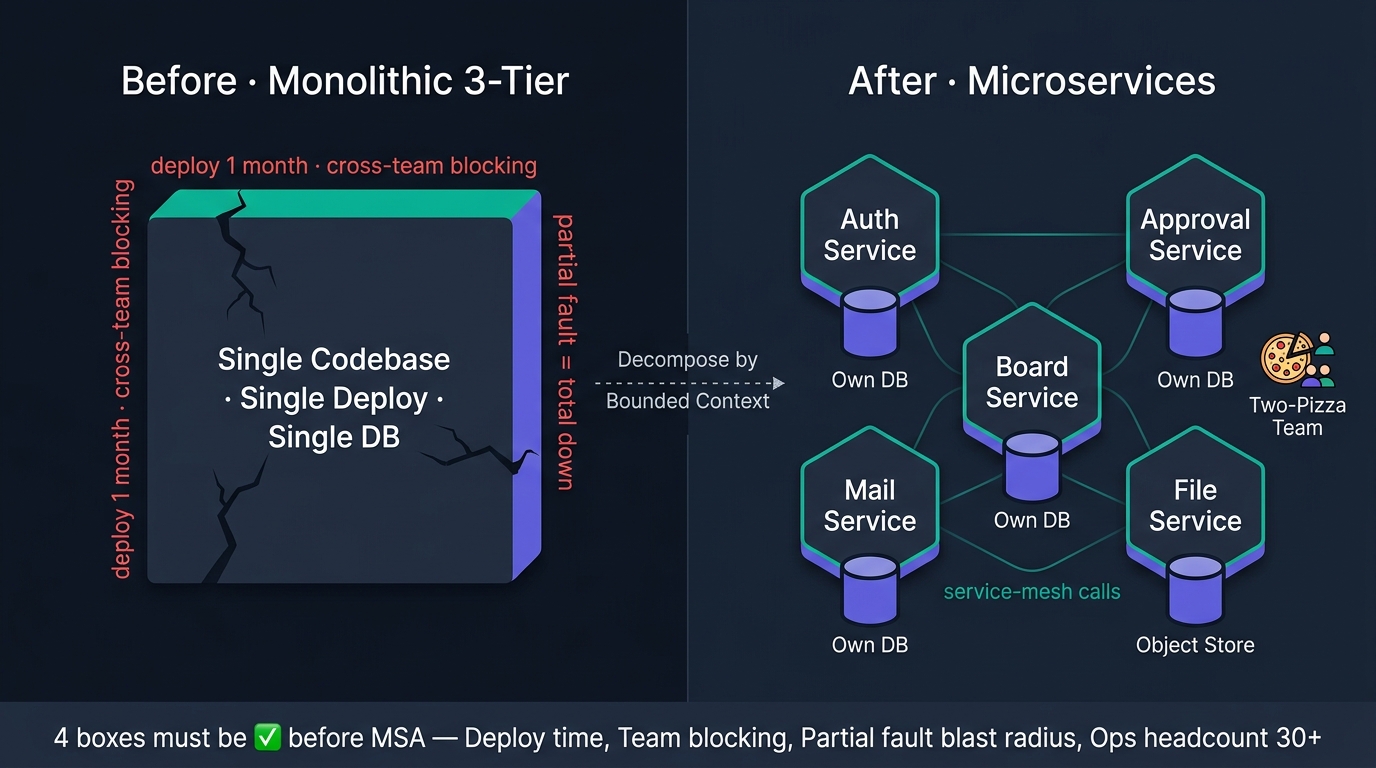
마이크로서비스 — 언제·어떻게 분해하는가?
🎯 분해 기준 (Bounded Context)
- 도메인 단위: 회원·주문·결제·배송
- 팀 단위: 한 팀 = 한 서비스 (Two-Pizza Team)
- 데이터 단위: 별도 DB 소유
- 배포 단위: 독립 배포 가능
📊 예시 — 사내 시스템 MSA 분해
- 회원 서비스 (Auth) → User DB
- 결재 서비스 (Approval) → Approval DB
- 게시판 서비스 (Board) → Board DB
- 메일 서비스 (Mail) → Mail DB
- 파일 서비스 (File) → Object Storage
⚠️ MSA의 함정
- 분산 트랜잭션 (Saga Pattern)
- 운영 복잡도 3~10배
- 네트워크 비용 ↑
- 트레이싱·로그 필수
- 컨테이너·K8s 운영 인력 필요
🎓 「언제 MSA로 가는가?」 체크리스트
- ☐ 모놀리식 배포가 한 달 이상 걸림
- ☐ 한 팀 변경이 다른 팀을 멈춤
- ☐ 부분 장애가 전체 중단
- ☐ 운영 인력 30+명
- 4개 모두 ✓ 이면 MSA 검토
🎨 이미지 프롬프트: "Editorial split illustration on dark navy #0f1722 background contrasting Monolith vs Microservices. LEFT HALF labeled 'Before · Monolithic 3-Tier': one large solid block labeled 'Single Codebase · Single Deploy · Single DB' with cracks running through it; thin red labels around it 'deploy 1 month · cross-team blocking · partial fault = total down'. A small dashed arrow points right with a label 'Decompose by Bounded Context'. RIGHT HALF labeled 'After · Microservices': five floating hexagonal service nodes arranged in a constellation, each clearly labeled — 'Auth Service', 'Approval Service', 'Board Service', 'Mail Service', 'File Service' — each with its own small DB cylinder underneath labeled 'Own DB' (or 'Object Store' for File). Subtle teal connecting lines between hexagons represent service-mesh calls. Bottom strip across both halves: '4 boxes must be ✓ before MSA — Deploy time, Team blocking, Partial fault blast radius, Ops headcount 30+'. Two-Pizza Team icon (small pizza+people) appears next to one of the hexagons. Clean editorial illustration style, teal #00b894 and purple #6c5ce7 accents, 16:9. CRITICAL: All visible text MUST be in English ONLY. Each label appears EXACTLY ONCE."
마이크로서비스 — 언제·어떻게 분해하는가?
3-Tier vs 마이크로서비스 — 결정 매트릭스
| 비교축 | 3-Tier | 마이크로서비스 |
|---|---|---|
| 개발 속도 | 빠름 (단일 코드베이스) | 느림 (분산 조율) |
| 배포 | 전체 동시 (위험) | 서비스 단위 (안전) |
| 운영 인력 | 5~20명 | 30명+ |
| 장애 격리 | 약함 (전체 중단) | 강함 (부분 영향) |
| 트랜잭션 | DB 트랜잭션 단순 | Saga·Eventual Consistency |
| 모니터링 | 단순 (APM 1대) | 복잡 (분산 트레이싱 필수) |
| 인프라 비용 | 낮음 | 높음 (K8s·서비스 메시) |
| 국내 표준 | 95% 시스템 | 대기업 일부·핀테크 |
📌 TA 의사결정 — 3-Tier 유지 vs MSA 이전 - 3-Tier: 「운영 인력 부족 + 시스템 잘 돌아감」 → 그대로 - MSA: 「배포 빈도 주 5회 + 팀 10개+ + 운영 30명+」 → 검토 시작
Part E. 국내 실제 시스템 매핑
대학 학사 · 공공 그룹웨어 · 금융 코어
5 슬라이드 · 약 8분
사례 ① — 대학 학사 시스템 (학생 1.2만 명)
🏫 구성
- 사용자: 학생 12,000 + 교직원 1,500
- 동시 접속: 평균 1,500 · 피크 8,000 (수강신청)
- 아키텍처: 4-Tier (+ Cache)
- 운영: 사내 데이터센터
🔧 계층별 구성
| 계층 | 제품 | 대수 |
|---|---|---|
| WAF | Penta WAPPLES | 2 (HA) |
| LB | F5 BIG-IP i7800 | 2 (HA) |
| Web | Nginx | 4 |
| WAS | JEUS 8 | 6 |
| Cache | Redis 7 Cluster | 3 |
| DB | Oracle 19c RAC | 2 |
| Storage | NetApp AFF A800 | 1 (Dual Controller) |
📊 SLA·성능
- SLA: 99.9% (연 다운타임 ≤ 8.76h)
- 응답시간: 화면당 < 2초
- 수강신청 피크: TPS 450 (안전계수 적용 675)
🔐 보안
- ISMS-P 인증 운영
- 개인정보보호법 적용 (학생 정보)
- 망분리: DMZ + 업무망 + 관리망
💰 5년 TCO
- 초기 구축: 25억
- 연간 운영: 8억 (라이센스·유지보수·인력)
- 총 5년: 약 60억
사례 ② — 공공 그룹웨어 (5,000명 사용)
🏛️ 구성
- 사용자: 직원 4,500 + 외주 500
- 동시: 평균 1,000 · 피크 2,500 (출근·점심)
- 아키텍처: 3-Tier (단순)
- 운영: 자체 IDC + DR (백업 센터)
🔧 계층별 구성
| 계층 | 제품 | 대수 |
|---|---|---|
| Anti-DDoS | Radware DefensePro | 1 |
| WAF | Penta WAPPLES | 2 |
| LB | HAProxy 2.x | 2 |
| Web | Nginx | 2 |
| WAS | Tomcat 10 | 4 |
| DB | Tibero 7 (TAC) | 2 |
| Storage | Dell PowerStore | 1 |
📊 특이 사항
- KCMVP 검증필 솔루션 만 사용 (공공)
- Tibero 사용 (Oracle 라이센스 대체)
- 국가정보원 보안적합성 검토 필수
- TTA 감리 분기 1회
🔐 보안
- 국정원 N등급 보안적합성 검증 완료
- 전자정부 인증 필수
- 개인정보보호법 + 정보통신망법 적용
💰 5년 TCO
- 초기 구축: 15억
- 연간 운영: 5억
- 총 5년: 약 40억
사례 ③ — 금융 코어 시스템 (고객 500만 명·24/7)
🏦 구성
- 사용자: 고객 500만 + 직원 1만 + 가맹점 50만
- 동시: 평균 5만 · 피크 20만 (월급일·연말)
- 아키텍처: 6-Tier (메인프레임 + 오픈계 듀얼 코어)
- 운영: 본센터 + 재해복구센터 (Active-Active 3-site)
🔧 계층별 구성
| 계층 | 제품 | 비고 |
|---|---|---|
| 메인프레임 | IBM z16 | 코어 거래 |
| 오픈계 WAS | JEUS·WebLogic·Spring Boot | 채널·내부 |
| DB | Oracle Exadata · DB2 | OLTP·정산 |
| 채널 | API GW(Kong) + MCI/EAI | 채널 통합 |
| Storage | EMC PowerMax · IBM DS8K | 동기 복제 |
| 보안 | HSM·KCMVP 모듈 | 키 관리 |
📊 SLA·운영 특성
- SLA: 99.99%~99.999% (연 5~52분 다운)
- 응답시간: 전·후순위 분리 — Online < 1초·Batch 야간
- 24/7 무중단 — 장애 시 즉시 뉴스·금감원 보고
- 전·후순위 거래 — Online(잔액·이체) vs Batch(정산·이자계산)
- 차세대 트렌드 — 메인프레임 → 오픈계 다운사이징·일부 MSA 전환 시도
🔐 보안·규제
- 전자금융감독규정 — 망분리·인증·암호화 강제
- 금융보안원 인증 + ISMS-P + PCI-DSS
- HSM(Hardware Security Module) 의무
- 3-site DR — Active-Active·RPO 0초·RTO < 1분
💰 5년 TCO
- 초기 구축: 1,000억+
- 연간 운영: 300억 (라이센스·인력·메인프레임)
- 총 5년: 2,500억+
4 사례 비교 — 내 시스템은 어디에 가까운가?
| 구분 | 대학 학사 | 공공 그룹웨어 | 금융 코어 |
|---|---|---|---|
| 사용자 | 1.2만 | 5,000 | 500만 |
| 동시 피크 | 8,000 | 2,500 | 200,000 |
| 아키텍처 | 4-Tier | 3-Tier | 6-Tier (+ 메인프레임) |
| SLA | 99.9% | 99.9% | 99.99%~99.999% |
| WAS | JEUS | Tomcat | JEUS + WebLogic + Spring Boot |
| DB | Oracle RAC | Tibero | Oracle Exadata + DB2 |
| 이중화 | LB·WAS·DB 모두 | LB·WAS·DB 모두 | 사이트 + 모든 계층 |
| DR | 백업·수동 복구 | 백업 센터 | 3-site Active-Active |
| 인증 | ISMS-P | ISMS-P + 국정원 | 금융보안원 + PCI-DSS |
| 운영 인력 | 8~12명 | 5~8명 | 100명+ |
| 5년 TCO | 60억 | 40억 | 2,500억+ |
Part F.
응답시간 분해 + 워크시트 연계
8 슬라이드 · 약 13분
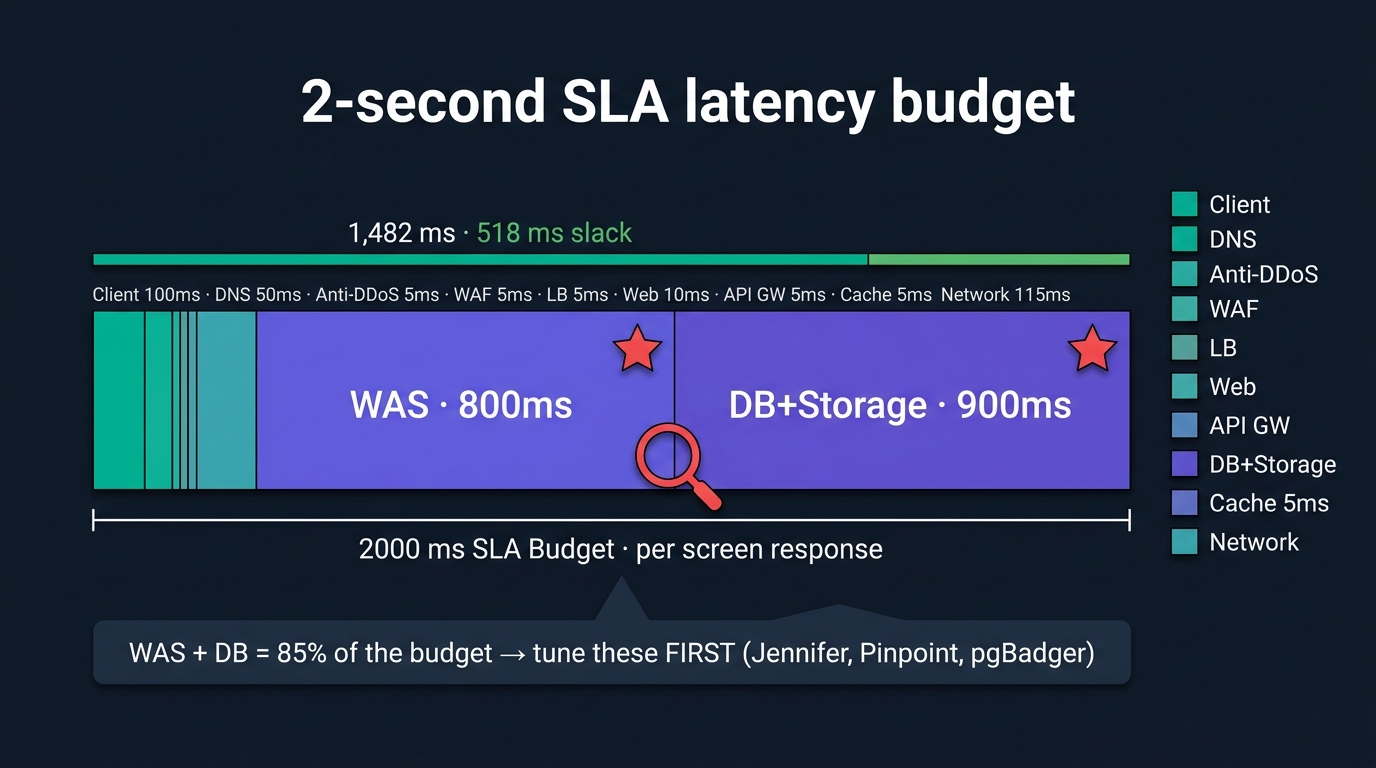
응답시간 분해 — SLA 「화면당 2초」를 10계층에 배분
| 계층 | SLA 배분 | 실측 평균 | 비고 |
|---|---|---|---|
| ① Client | 100 ms | 80 ms | 브라우저 렌더링 |
| ② DNS | 50 ms | 5 ms | 캐시되면 0 ms |
| ③ Anti-DDoS | 5 ms | 3 ms | 정상 트래픽 |
| ④ WAF | 5 ms | 4 ms | 룰 평가 |
| ⑤ LB | 5 ms | 2 ms | 라우팅 |
| ⑥ Web | 10 ms | 5 ms | 정적·프록시 |
| ⑦ API GW (선택) | 5 ms | 3 ms | 인증·라우팅 |
| ⑧ WAS | 800 ms | 600 ms | 비즈니스 로직 ★ |
| ⑨ Cache | 5 ms | 0.5 ms | 캐시 히트 |
| ⑩ DB·Storage | 900 ms | 700 ms | I/O·트랜잭션 ★ |
| 네트워크 왕복 | 115 ms | 80 ms | 각 단계 합산 |
| 총합 | 2,000 ms | 1,482 ms | 여유 518 ms |
💡 TA 분석법 — 2초 SLA 미달 시 「WAS·DB」가 합쳐 1.7초를 차지. 모니터링·튜닝 1순위.
🎨 이미지 프롬프트: "Editorial horizontal stacked bar chart illustration on dark navy #0f1722 background visualizing the '2-second SLA latency budget' broken down across 10 layers. ONE long horizontal bar at the center spanning most of the canvas labeled '2000 ms SLA Budget · per screen response'. The bar is divided into colored segments proportional to their share: tiny teal slices for 'Client 100ms · DNS 50ms · Anti-DDoS 5ms · WAF 5ms · LB 5ms · Web 10ms · API GW 5ms · Cache 5ms · Network 115ms', and two HUGE purple slices labeled prominently 'WAS · 800ms' and 'DB+Storage · 900ms' marked with red star icons ★. Above the bar a thinner reference bar showing actual measured times totaling '1,482 ms · 518 ms slack' in green. Right side has a vertical legend with each layer color-coded. Bottom callout box says 'WAS + DB = 85% of the budget → tune these FIRST (Jennifer, Pinpoint, pgBadger)'. A red magnifying glass icon hovers over the two large purple slices. Clean editorial illustration style, teal #00b894 / purple #6c5ce7 / red accents, 16:9. CRITICAL: All visible text MUST be in English ONLY. Each label appears EXACTLY ONCE."
응답시간 분해 — SLA 「화면당 2초」를 10계층에 배분
병목 식별 — APM으로 SLA 위반 구간 찾기
🔍 단계별 측정 도구
- Client: Lighthouse · WebPageTest · Chrome DevTools
- DNS·LB: F5 iControl · HAProxy stats
- Web: Nginx Access Log + ELK
- WAS: Jennifer (★) · Pinpoint · Scouter
- DB: Oracle EM · pgBadger · pg_stat_statements
- Storage: NetApp ONTAP · iostat
📊 핵심 지표
- TPS (Transactions Per Second)
- P95·P99 응답시간 (평균 X)
- Error Rate (4xx·5xx %)
- Concurrent Users
🎯 「병목 5가지 분류」
- CPU Bound — WAS 스레드 100% 사용
- I/O Bound — DB·Storage Wait 높음
- Lock Contention — DB Row Lock 대기
- GC Pause — JVM Full GC 빈번
- Network — 패킷 손실·지연
🛠️ 대응 1차 조치
- WAS 스레드 풀 증가 → CPU
- DB 인덱스 추가 → I/O
- 쿼리 튜닝 → Lock
- JVM 옵션 변경 → GC
- NW 경로 검사 → Network
흐름 설계 — TA 의사결정 체크리스트
✅ 흐름 설계 시 확인 10가지
- ☐ 10계층 흐름도 작성 (논리 + 물리)
- ☐ 각 계층 SLA 배분 명시
- ☐ SPOF 식별·이중화 방안 결정
- ☐ 망분리 경계 (DMZ ↔ 업무망 ↔ 관리망)
- ☐ 프로토콜·포트 명세서
- ☐ 외부 인터페이스 명세서
- ☐ 응답시간 측정 도구 결정 (APM)
- ☐ 백업·복구 흐름 별도 명시
- ☐ 보안 통제 ISMS-P 매핑
- ☐ TTA 감리 산출물 준비
📋 산출물 (감리 표준)
- 시스템 구성도 (논리·물리)
- 인프라 구성 명세서
- 외부 인터페이스 명세서
- 프로토콜 사용 명세서
- 응답시간 SLA 정의서
- SPOF 분석 보고서
- 이중화 설계서
🇰🇷 국내 표준 박스
- TTA 감리 가이드 — 위 7종 산출물 모두 점검
- NIA 규모산정 지침 — 용량 산정
- ISMS-P — 보안 통제
- KISA 망분리 가이드 — DMZ 분리
흐름 설계 — 주니어 TA가 흔히 하는 실수 5가지
❌ 실수 1 — 흐름도에 「Internet → DB」 직접
- 「화살표 한 줄」로 끝내고 10계층 누락
- → 검토자가 보안·SPOF 평가 불가능
❌ 실수 2 — 단일 구성에 「99.9% SLA」
- LB 1대·DB 1대로 99.9% 약속
- → 다운 1회로 SLA 박살
❌ 실수 3 — 응답시간 배분 없음
- 「응답시간 2초」만 적고 어디서 쓰는지 미상
- → 운영 중 튜닝 불가능
❌ 실수 4 — KCMVP 미확인
- 「F5만 쓰면 OK」 → 공공기관 도입 불가
- → 사업 자체 거절
❌ 실수 5 — 망분리 무시
- DMZ 없이 Web·WAS 같은 구역
- → ISMS-P 인증 박탈
✅ TA의 「3 must」
- 10계층 모두 그림
- 이중화 모두 명시
- 국내 표준·제품 매핑
Session 2 — 정리
🎯 오늘 다룬 것
- 아키텍처 패턴 — 모놀리식·3-Tier·N-Tier·MSA
- 3-Tier 계층 — Presentation·Logic·Data + 망분리
- 요청 10계층 — Client → DNS → 보안 → LB → Web → APIGW → WAS → Cache → DB → SAN
- N-Tier 확장 — 4·5·6 Tier · K8s 위치
- 국내 사례 — 대학·공공·금융 비교
- 응답시간 분해 — SLA 2초 배분
- TA 체크리스트 — 흐름 설계 10항
💡 핵심 메시지 (TOP 3)
- 사용자 요청은 평균 10단계를 통과한다 — 흐름을 모르면 장애·SPOF·SLA 모두 불가
- 국내 95%는 3-Tier 또는 4-Tier — MSA는 운영 인력·기술 갖춘 곳만
- KCMVP·ISMS-P·KISA 망분리 — 한국 특수 표준이 아키텍처를 결정
🇰🇷 표준 참조
- 국내: ISMS-P · TTA 감리 · KCMVP · KISA 망분리 · 전자정부 인증
- 글로벌: TOGAF (참고) · ITIL 4 · ISO 27001
Session 2 — 마무리
📝 워크시트 D1-3
- 점심 후 진행 (60분)
- 본 세션 Part C — 10계층 추적 슬라이드(s2-017 ~ s2-026, 즉 slide 17~26)를 그대로 표준 답안으로 활용 가능
- 강사 답안 + 해설 별도 배포
🎓 다음 단계
- 오후 1시: Session 2 (서버·OS·가상화)
- 14:30: Session 3·4 (네트워크)
- 16:00: Session S (구조도·SPOF)
- 「흐름」을 알았으니 「장비」를 본다
💼 실무 적용 — 이번 주 안에 해볼 것
- 현재 시스템 구성도 직접 10계층으로 그리기
- 각 계층 제품·버전·라이센스 표로 정리
- 응답시간 측정 (Jennifer·Pinpoint 등)
- SPOF 찾기 — 1대 구성된 컴포넌트
- 국내 표준 매핑 — ISMS-P·KCMVP