Session 8
HA · 용량 · 관찰성 · 장애 · 자동화
Day 2 · TA의 운영 종합 세션
고가용성 · SLA · 클러스터링 · 용량 산정 · 관찰성 3대 축 · 장애 대응 · IaC · SRE
강사 박수현 · 🚀 젠아이랩스(GenAI Labs)
🎨 이미지 프롬프트: "Editorial wide shot — a focused Korean SRE engineer (30s, hoodie + glasses) seated in a dim NOC room at NHN TCC1 IDC Pangyo facing a wide curved 49-inch monitor wall; the monitor wall shows three side-by-side dashboards: left dashboard 'Grafana 11.x — SLO Overview' with green/teal availability gauges '99.99% (Error Budget 21min left, 28d window)' and four SLI tiles 'Availability 99.991% · Latency p95 412ms · Error rate 0.06% · MTTR P50 12min', middle dashboard 'Datadog Service Map' with hexagonal nodes (api-gateway → payment-svc → postgres-primary) latency color-coded yellow/red and stacked metrics charts (CPU 68% · Memory 75% · Disk IOPS 42K · Network 18Gbps), right dashboard 'Jaeger 1.6 trace timeline' with a distributed-trace flame graph (12 spans, root span 1.8s, slowest child span 'pg-query SELECT orders' 1.4s highlighted red) and a red Alertmanager banner 'PROD-DB-01 DiskFull · severity=critical · pcs status: db-cluster DEGRADED'; behind the engineer two 42U server racks (Dell PowerEdge R760 + HPE ProLiant DL380 Gen11) with status LEDs and a faint world map showing two DR sites (서울 본사 ↔ 천안 DR, 142km NetApp MetroCluster IP sync arc) connected by a glowing teal arc labeled 'RPO 0 · RTO 4min'; on the desk a coffee mug, a Pacemaker/Corosync RHEL 9.4 cheatsheet card, and a PagerDuty mobile alert glow; soft cinematic lighting, dark navy background with teal #00b894 and purple #6c5ce7 accents, calm focused atmosphere, 16:9"
왜 HA·용량·장애인가 — 국내 서비스 장애 3선
💥 ① KT 라우팅 마비
2021.10.25 (월)
야간 승인 작업을 주간에 진행하던 중 라우팅 명령어 한 단어 누락 → 전국 89분 인터넷 마비. 결제·증권 HTS·POS 동시 정지.
- 작업관리자 부재 (협력업체 단독 작업)
- 변경 윈도우(승인 시간) 위반
- 통신사 BGP 라우팅 SPOF
💡 교훈 — 변경관리 SOP(CR·CAB·승인 윈도우)·작업관리자 의무·BGP 라우팅 격리 시험
참고: 과기정통부 「KT 네트워크 장애 원인분석」 보도자료
💥 ② LG U+ 디도스·고객정보 유출
2023.01.29 / 1~2월
1.29 새벽·오후 3회·총 63분 인터넷 마비 (DDoS). 별건으로 1월 29만 명 가입자 정보 다크웹 유출 — 18만 명 현행, 11만 명은 해지 고객 보관 데이터.
- 분리 보관 중인 해지 고객 DB까지 노출
- DDoS 방어·관찰성·격리 모두 부족
- 과징금 68억 + 과태료 2,700만 (방통위)
💡 교훈 — DDoS 방어(BGP Blackhole·세션 외부화)·관찰성(NW 알람)·개인정보 보존 정책·해지 데이터 격리
참고: 정책브리핑 「LGU+ 고객정보 유출·디도스 원인분석」
💥 ③ 정부24 개인정보 오발급
2024.04~05
납세증명서 서식 변경 시 소스코드 수정 후 핵심 테스트 누락 → 교육증명서·납세증명서 발급 시 타인 정보 1,233건 노출. 한 달간 미공개로 추가 비판.
- 변경 테스트 SOP 누락 (단위·통합·회귀)
- 한 달간 사실 은폐
- 행안부에 과징금 2.7억
💡 교훈 — CI/CD 회귀 테스트·캐시·세션 격리·변경 후 모니터링·장애 보고 SOP(공개 의무)
참고: 경향신문 「정부24서 1200건 문서 오발급」
📌 이번 세션의 시각 — 위 3건은 「변경관리 SOP 부재」「관찰성·격리 부족」「테스트·자동화 누락」. 본 세션의 HA 패턴·SLA·용량 산정·관찰성·장애 5종·IaC가 직접 해법.
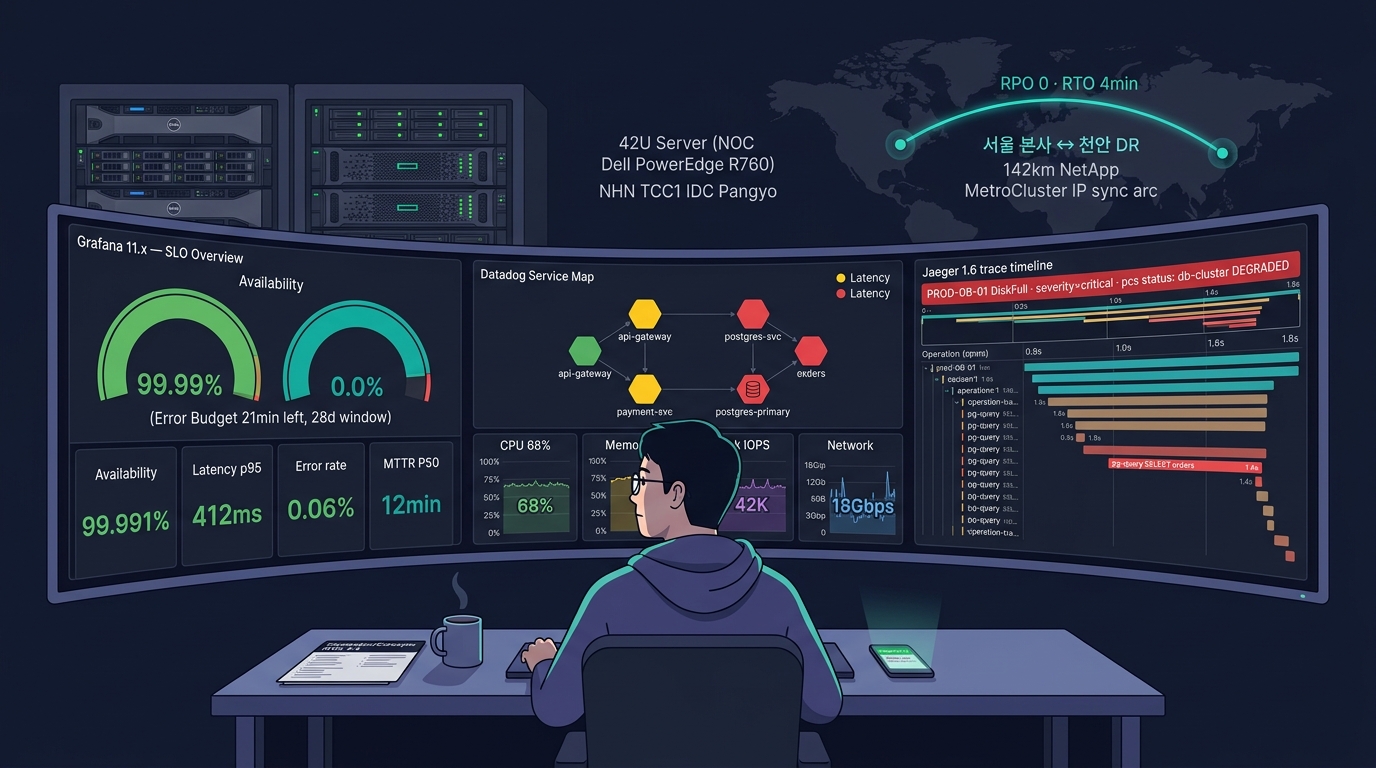
Day 2 · TA의 운영 종합 세션
Session 8 — 회차 메타데이터
📋 세션 정보
- 회차: 9 / 15
- 소속: Day 2 — HA·운영·관찰성 통합
- 카테고리: operations-architecture
- 예상 분량: 본문 86 슬라이드 + 이미지 16장
- 강의 시간: 60분
- 강사: 박수현 — 젠아이랩스(GenAI Labs) CEO / CTO
🎯 핵심 메시지
TA는 멈추지 않게(HA) · 감당하게(용량) · 보이게(관찰성) · 회복하게(장애 대응) · 반복 가능하게(자동화) 만든다. 다섯 축은 따로가 아니라 한 묶음의 운영 시스템.
🧭 학습 목표
- HA 패턴 5종 — N+1·N+M·2N·2N+1·Active-Active의 비용·복잡도·가용성 비교
- SLA 매트릭스 — 99~99.9999% 6단계의 다운타임·비용·적용 영역 환산
- 클러스터링 5계층 — App·DB·OS/HW·Storage·Network 대표 솔루션과 동작 원리
- 용량 산정 5단계 — 요구사항→TPS→CPU/Mem/IOPS/NW→마진→검증 수행
- 관찰성 3대 축 — Metrics·Logs·Traces 역할 분담과 대표 스택 설계
- 장애 대응 5단계 — Detection→Containment→Investigation→Recovery→Postmortem + RCA 5기법
- SRE·IaC — SLI/SLO·Error Budget·Toil 자동화·IaC 도구 체계 도입
PART A
HA 패턴 · SLA — 서비스 무중단을 보장하는 SLA
무중단 서비스 = SLA로 정의한 가용성 목표 + HA 패턴으로 구현한 이중화 구조.
HA — 왜 필요한가
🚨 다운타임의 비용
- 이커머스 1시간 다운 — 매출 손실 + 평판 + 환불·보상
- 금융 코어 1시간 다운 — 거래 정지·집단민원·금감원 보고
- 공공 LMS 1시간 다운 — 시험·강의 중단, 민원 폭주
- 통신 코어 1분 다운 — 119·112 영향, 사회 인프라
- 평균 비용 — 분당 수백만~수억 원 (산업별 상이)
🎯 HA가 보장하는 것
- 계획된 다운 (패치·업그레이드) 중에도 서비스 유지
- HW·SW·NW 단일 고장(SPOF) 발생 시 자동 회복
- 사이트 재해(화재·정전·랜섬웨어) 발생 시 DR 사이트로 절체
🧱 HA = 3계층 동시 설계
- 인프라 계층 — 전원 A/B·UPS·발전기·이중 회선·이중 스위치
- HW·OS 계층 — PSU 이중화·NIC Bonding·HBA Multipath·RAID
- App·DB·MW 계층 — LB+다중 노드·DB 클러스터·세션 공유·MQ 클러스터
⚠️ TA의 흔한 오해
- "이중화만 하면 가용성이 100%" — 틀림. 가용성은 곱셈으로 감소
- "Active-Active가 무조건 우수" — 틀림. 정합성·운영 복잡도가 비싸짐
- "DR 사이트가 있으니 충분" — 틀림. 훈련 안 된 DR은 거의 작동 안 함
HA는 "장비를 더 사는 것"이 아니라 "장애를 견디는 구조를 설계하는 것" — 가장 약한 고리가 전체를 결정한다.
HA 패턴 — N+1 · N+M · 2N · 2N+1 · Active-Active
| 패턴 | 구성 | 자원 효율 | 비용 | 가용성 | 적합 |
|---|---|---|---|---|---|
| N+1 | N대 운영 + 1대 예비 | 높음 (N/(N+1)) | 낮음 | 중간 (단일 노드 장애만) | VMware HA·K8s 클러스터 |
| N+M | N대 운영 + M대 예비 | 높음 | 중간 | 높음 (M개 동시 장애) | 대규모 클러스터·HPC |
| 2N (Active-Standby) | 1:1 페어 (전체 이중화) | 50% (유휴) | 중간 | 높음 | DB Standby·FW HA·전원 A/B |
| 2N+1 | 2N + 1대 예비 | 낮음 | 높음 | 최고 | 통신 코어·미션 크리티컬 |
| Active-Active | 양쪽 모두 운영, 부하 분산 | 최고 | 중간 | 매우 높음 | Web·WAS·NoSQL·Geo |
선택 기준: 자원 효율(N+1) ↔ 가용성(2N+1) 사이의 트레이드오프. TA는 시스템 등급(BIA) × 라이센스 비용 × 운영 복잡도 3축으로 결정한다.
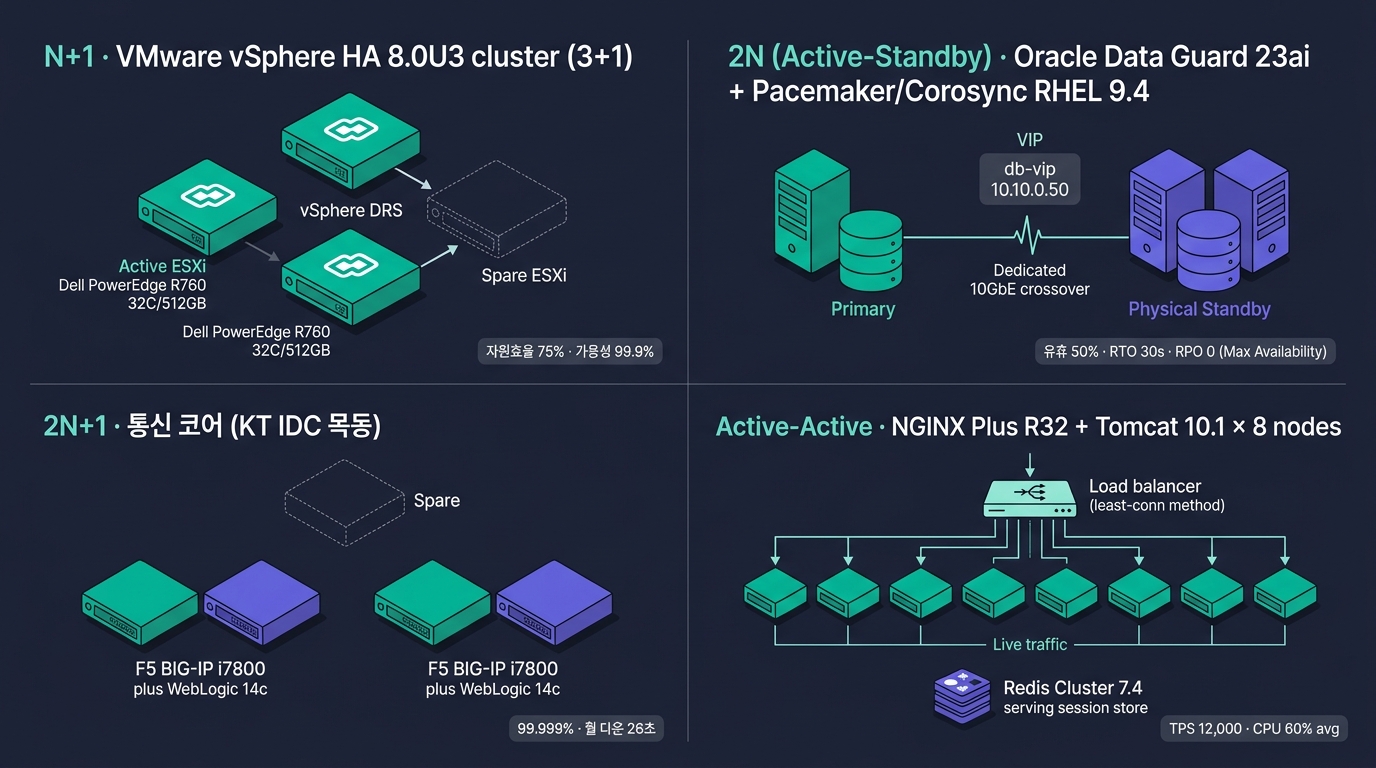
HA 패턴 다이어그램 (삽화)
Active-Active vs Active-Passive — 언제 어느 쪽?
🟢 Active-Active
- 두 노드 모두 요청 처리
- 부하 분산 (LB·DNS·Anycast)
- 자원 100% 활용
- 장애 시 잔존 노드가 전 부하 인수 → 사전 용량 마진 필수
- 세션 공유 (Redis·Memcached·Sticky)
- 데이터 정합성 부담 (Conflict resolution)
- 적합: 무상태 Web/WAS, NoSQL, K8s, Web Cache
🔵 Active-Passive (Active-Standby)
- 한 노드만 운영, 다른 노드는 대기
- 단순한 구조 · 정합성 부담 없음
- 자원 50% 유휴 (비용 부담)
- 절체 시 수십 초~수 분 다운 (RTO)
- 적합: RDBMS (Oracle DG·MSSQL AG), 파일 서버, MQ, Stateful 일반
TA의 결정 규칙: 무상태(Web·API) → A/A 우선. 상태 보유(DB·MQ·파일) → A/S 우선. 단, 읽기 부하가 큰 DB는 Read Replica 패턴으로 A/A 흉내 가능.
Geographic Redundancy — HA를 사이트 단위로 확장
📐 거리 설계 원칙 (HA 관점)
- 동기 복제 한계 ≈ 100km 이내 (RTT 2ms 부담)
- 동일 도시 50~100km 분리 — 지진·정전 동시 영향 회피
- 비동기 복제 — 거리 제약 없음, RPO 존재
- 3-Site (Tri-Site) — 동기 1조 + 비동기 1조 = 통신·금융 핵심
- HA 패턴(2N·Active-Active)을 사이트 간으로 확장한 형태
📚 Multi-Site 패턴 본문(Cold DR · Pilot Light · Warm · Hot) 은 Session 6
## DR 5단계참조 — RTO/RPO·비용 표와 등급별 채택 패턴 포함.
🇰🇷 한국 사례 — 동기 복제 한계 100km
- 금융권 — 본사(서울) + DR(천안·대전·세종) — 거리 100~150km, 100km 이내 구간은 동기 복제
- 공공 — 정부세종청사 + 광주·대구 DR
- 이커머스 — 자가 IDC + AWS 멀티 리전
- 재난 통신 — 본사 + 부산 + 제주 3-Site
⚠️ HA 함정 (사이트 단위)
- DR 사이트 = 평시 미사용 → 훈련 부족 → 실제 재해 시 작동 안 함
- DR 회선 단일 → 사이트 절체 시점에 회선도 동시 절단 사례
- DB만 복제·App·MW 미동기화 → 절체 후 부정합
SLA 매트릭스 — 9의 개수로 환산하는 다운타임
| 가용성 | 9 개수 | 연간 다운 | 월간 다운 | 주간 다운 | 일일 다운 | 적용 영역 |
|---|---|---|---|---|---|---|
| 99% | 2 nines | 3.65일 | 7.2시간 | 1.68시간 | 14.4분 | 내부 위키·테스트 |
| 99.9% | 3 nines | 8.76시간 | 43.8분 | 10.1분 | 1.44분 | 일반 업무·중소 SaaS |
| 99.95% | 3.5 nines | 4.38시간 | 21.9분 | 5.04분 | 43.2초 | 중간급 SaaS |
| 99.99% | 4 nines | 52.6분 | 4.38분 | 1.01분 | 8.64초 | 금융·결제·코어 업무 |
| 99.999% | 5 nines | 5.26분 | 26.3초 | 6.05초 | 0.86초 | 통신·119·112 |
| 99.9999% | 6 nines | 31.5초 | 2.63초 | 0.6초 | 0.09초 | 군사·우주·비현실 |
환산 공식: 연간 다운(초) = 31,536,000 × (1 - 가용성). 이 표는 TA가 외워야 하는 핵심.
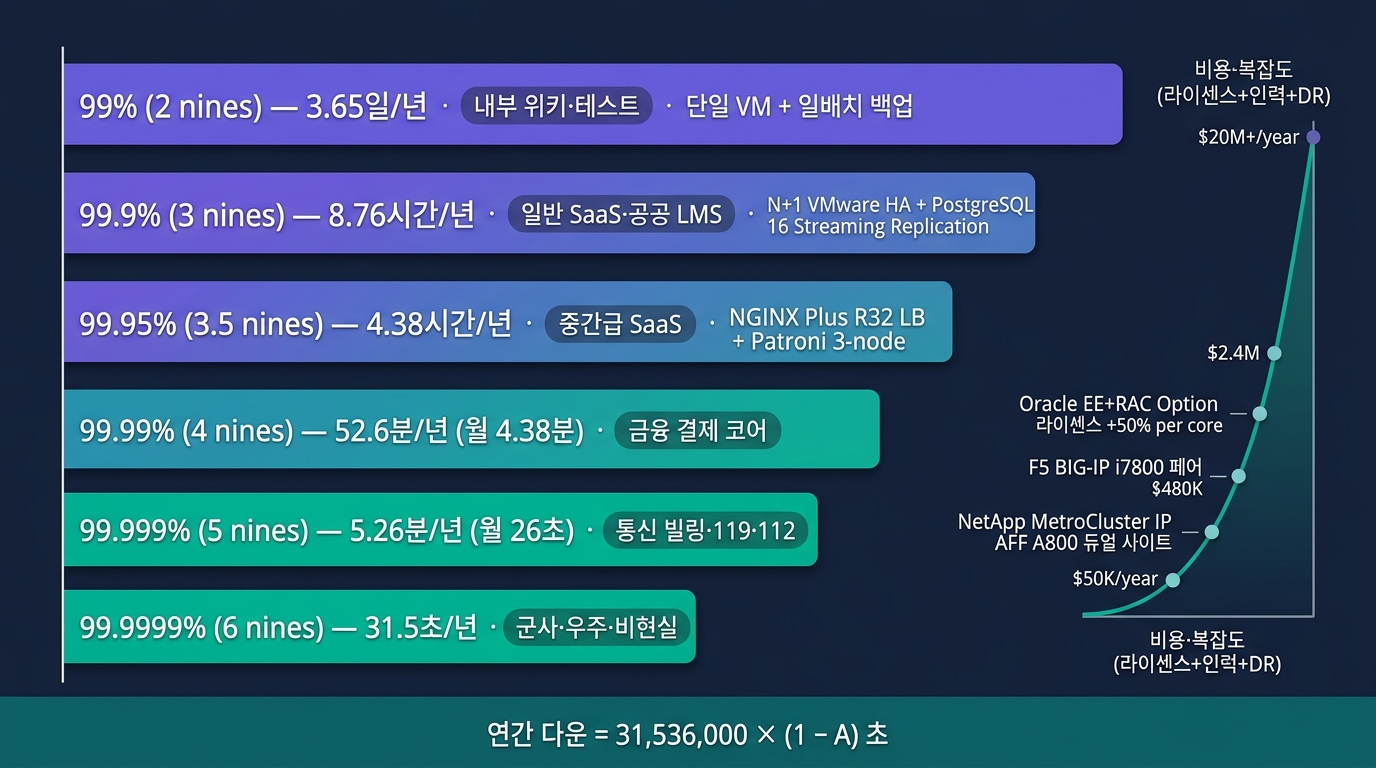
SLA 등급 차트 (삽화)
SLA 위반 — 계약 페널티의 구조
📜 표준 SLA 계약 조항
- 가용성 약정 — 월간 99.9% 이상
- 응답시간 약정 — 평균 1초 이내, p95 3초 이내
- 장애 통지 — 5분 이내 1차, 30분 이내 상세
- 복구 약정 — RTO 4시간, RPO 1시간
- 위반 페널티 — 월 사용료의 5%·10%·25% 단계 환불
🚨 실제 위반 사례
- AWS S3 2017 — 4시간 다운, 다수 SaaS 동반 장애
- Facebook 2021 — 6시간 BGP 설정 오류
- 카카오 2022 — 데이터센터 화재 9시간+
- MS Azure 2024 — CrowdStrike 패치 8.5M 시스템 다운
💰 페널티 구조 예시
- 월 가용성 99.9% 약정 → 99.5% 실측
- 위반 시간 = (99.9 - 99.5)% × 30일 = 약 2.88시간
- 단계별 환불:
- 99.9 → 99.0%: 5% 환불
- 99.0 → 95.0%: 10% 환불
- 95.0% 미만: 25% 환불
⚠️ TA의 관심사
- SLA 측정 주기 — 월·분기·연 (분기가 가장 흔함)
- 계획된 점검 제외 약정 — 사전 통지 시 다운타임 제외
- 불가항력 제외 — 재해·국가 비상사태
- 연쇄 장애 책임 한계 — 3rd party 의존 시 분리
가용성 공식 — 직렬·병렬·MTBF·MTTR
🧮 기본 공식
- 가용성 A = MTBF / (MTBF + MTTR)
- MTBF (Mean Time Between Failures) — 고장 간 평균 시간
- MTTR (Mean Time To Repair) — 평균 복구 시간
- MTBF↑ + MTTR↓ → 가용성↑
🔗 직렬 시스템 (Series)
- 두 컴포넌트가 직렬 연결 → 곱셈으로 감소
- A_total = A₁ × A₂ × A₃
- 예: 99.9% × 99.9% × 99.9% = 99.7% (8.76시간 → 26시간)
- 약한 고리가 전체를 결정
🟰 병렬 시스템 (Parallel·이중화)
- 두 컴포넌트가 병렬 → 장애 확률 곱셈
- 1 - A_total = (1 - A₁) × (1 - A₂)
- 예: 99% × 99% 병렬 = 99.99% (3.65일 → 53분)
- 이중화의 수학적 위력
📐 복합 예시
- DB Active-Standby (각 99.9%) → 병렬 → 99.9999% (이론)
- 그 위에 NW·App 직렬 → 현실은 99.95~99.99%
- 결국 NW·App이 병목이 되는 경우가 가장 흔함
HA 결정 트리 — 어떤 패턴을 고를까
결정 입력값: 시스템 등급(BIA) · 상태 보유 여부 · 라이센스 비용 · 운영 인력 · DR 거리 — 5개를 항상 함께 본다.
PART C
용량 산정 5단계 — 요구사항부터 검증까지
"감으로 사이징"이 아니라 공식 + 가정값 + 마진의 조합.
용량 산정 — 5단계 워크플로
📥 1단계 입력값 (BA·SA·DA로부터)
- 사용자 규모 (MAU·DAU·동접)
- 트래픽 패턴 (피크 시간·평균 vs 피크 비율)
- 트랜잭션 종류 (조회·등록·결제·배치)
- 응답시간 SLA (평균·p95·p99)
- 데이터 규모 (현재·5년 증가율)
- HA 요구 (가용성 등급·RPO·RTO)
📤 5단계 출력물 (TA 산출물)
- 자원 산정서 — CPU·Mem·Disk·IOPS·NW
- BOM — 모델·수량·라이센스
- 부하 테스트 결과서 — 실측 TPS·응답시간
- 마진·가정값 명세 — 재산정 가능성 확보
- 확장 계획 — Scale-up·Scale-out 시점
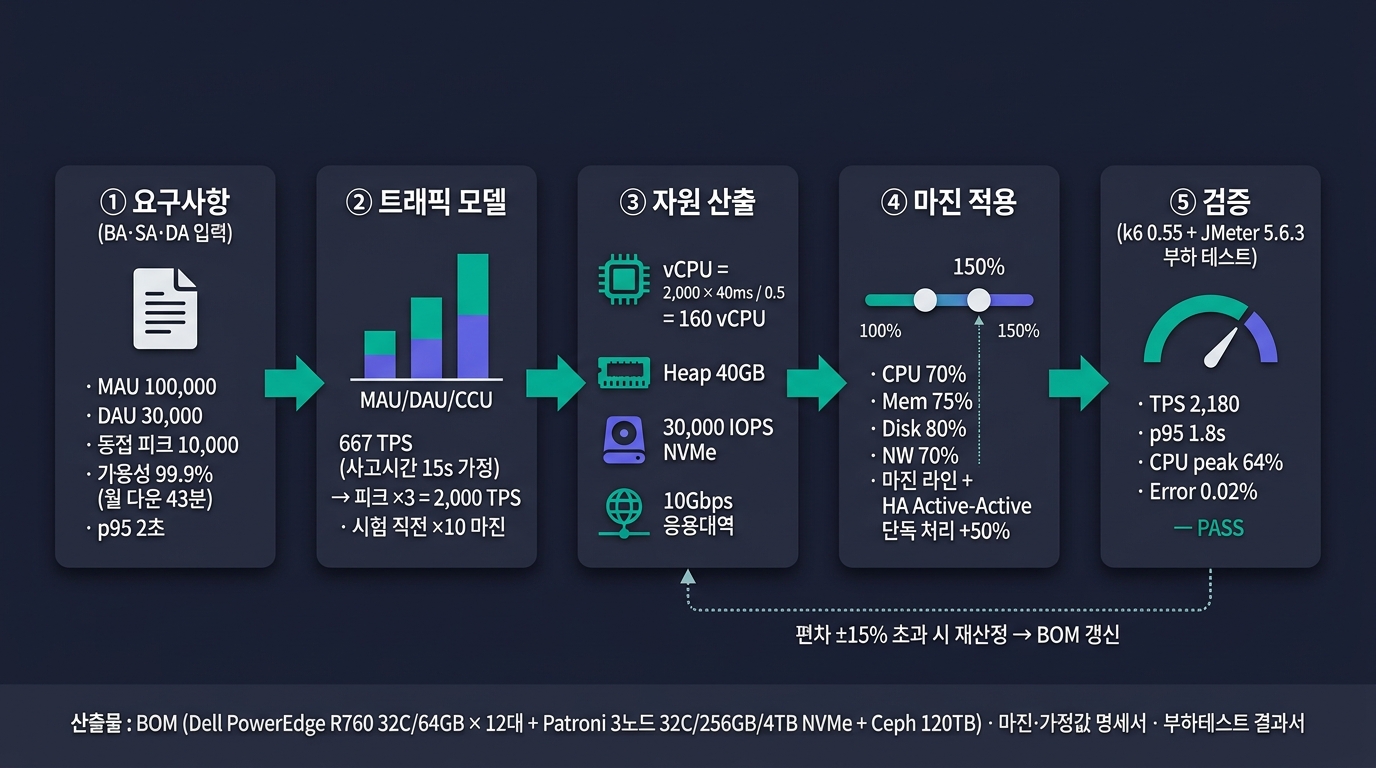
용량 산정 흐름 (삽화)
TPS 산정 — MAU·DAU·동접·세션
📊 사용자 지표 변환
- MAU (Monthly Active User) — 월간 활성
- DAU (Daily Active User) ≈ MAU × 10~30%
- MAUR (Monthly Active Use Ratio)
- 동접 (Concurrent User) ≈ DAU × 5~15% (피크 시점)
- 세션 수 ≈ 동접 × 1.2~1.5 (멀티 디바이스)
🧮 TPS 공식
- 사용자당 TPS = 1 ÷ 평균 사고시간(Think Time, 초)
- 사고시간(Think Time) = 사용자가 한 화면에 머무는 시간 (accident 아님)
- 총 TPS = 동접 × 사용자당 TPS
- 피크 TPS = 평균 TPS × 2~3배 (이벤트 마진)
📈 사고시간(Think Time) 표준값
| 시스템 유형 | 사고시간(Think Time) | 사용자당 TPS |
|---|---|---|
| 일반 업무·인트라넷 | 30~60초 | 0.02~0.03 |
| 포털·게시판 | 10~30초 | 0.03~0.1 |
| 이커머스·금융 | 5~15초 | 0.07~0.2 |
| 게임·실시간 | 1~5초 | 0.2~1.0 |
| 결제·인증 API | 즉시 | 1+ |
📐 예시 산정
- 공공 LMS — MAU 10만 → DAU 2만 → 동접 2,000 → TPS = 2,000 × (1/30) = 67 TPS
- 피크 마진 3배 → 200 TPS 목표
TPS — 평균·피크·이벤트 분리
⏰ 시간대별 분포
- 업무 시스템: 09~11시·14~16시 더블 피크
- 이커머스: 12시 점심·20~22시 저녁 피크
- 공공 민원: 09~10시 단일 피크
- 공공 LMS: 학기 초·시험 직전 폭증 (10배+)
- 결제·세금: 분기말·연말 폭증
📊 마진 계수
- 일중 피크/평균 비율 — 2~5배
- 연간 이벤트 피크 — 5~20배 (공공 시험·블랙프라이데이)
- HA 절체 마진 — Active-Active 한쪽 죽었을 때 단독 처리 가능
🎯 산정 등급별 목표
- 평균 부하 처리 — CPU 30~40%
- 피크 부하 처리 — CPU 50~60%
- 이벤트 부하 처리 — CPU 70~80%
- HA 단독 처리 시 — CPU 80~90%
⚠️ 함정
- 평균만 산정 → 피크에 다운
- 피크만 산정 → 평소 자원 낭비
- 이벤트 무시 → 시험 직전 폭증 시 사고
- HA 절체 마진 0 → 한쪽 죽으면 동반 다운
TA의 관행: 평균 산정 후 피크 ×3배 마진 + HA 절체 마진 +50% = 안전한 사이징.
CPU 산정 — SPECint · TPC-C · TPS/Core
🧠 CPU 성능 지표
- SPECint / SPECfp — 정수·부동소수점 벤치마크
- SPECjbb — Java 비즈니스 벤치마크
- CoreMark — 임베디드 멀티코어
- TPC-C / TPC-H / TPC-E — DB OLTP·DSS·증권
- TPS/Core — 실제 트랜잭션 처리량 (가장 직관적)
🧮 산정 공식
- 필요 vCPU = TPS × (트랜잭션당 CPU ms) ÷ 1000 ÷ 목표 사용률
- 목표 사용률 — 50~60% (피크 마진)
- 예: 100 TPS × 40ms ÷ 1000 ÷ 0.5 = 8 vCPU
📊 트랜잭션당 CPU ms 표준값
| 트랜잭션 유형 | CPU ms |
|---|---|
| 단순 조회 (SELECT) | 5~20ms |
| 일반 업무 트랜잭션 | 20~50ms |
| 복잡한 보고서·집계 | 100~500ms |
| 결제·인증 (암호화 포함) | 50~200ms |
| 배치·ETL | 초~분 |
⚠️ 추가 가산
- 가상화 오버헤드 +5~10%
- 컨테이너 오버헤드 +3~5%
- 암호화 (TLS·DB TDE) +10~30%
- 세션 인증 +5~10%
CPU 사이징 — 6단계 실무 절차
🔁 사이징 6단계 절차 (실무 워크플로)
- 워크로드 분류 — OLTP·OLAP·WAS·캐시·AI
- TPS·동접·세션 도출 — 현행 운영 메트릭
- 단위 처리당 vCPU — PoC·과거 데이터 환산
- 평균/피크 사용률 — 평균 50~60%·피크 ≤80%
- 라이센스 영향 — Per-Core SKU 역산 (Compute 회차 참조)
- BOM 확정 + 마진 — 증설·HA 여유 20~30%
🎯 단계별 산출물
- ① → 워크로드 매트릭스 (시스템별 분류표)
- ② → TPS 산정표 (현행/목표/피크)
- ③ → 단위 vCPU 환산표 (트랜잭션당 CPU ms)
- ④ → 사용률 목표 (평균·피크·HA 절체)
- ⑤ → SKU 후보군 (Per-Core 라이센스 역산)
- ⑥ → 최종 BOM (모델·수량·라이센스 합계)
💡 단계별 핵심 결정
- ① 워크로드 분류 — OLTP는 코어 수보다 클럭(IPC) 중시, OLAP는 코어 수 우선
- ② TPS 도출 — 평균이 아닌 피크 기준, 마진 ×3 적용
- ③ vCPU 환산 — PoC 측정값 없으면 트랜잭션당 40ms (일반 업무 관행)
- ④ 사용률 목표 — 평균 50~60%·피크 ≤80% 유지 (HA 절체 시 단독 처리 마진)
- ⑤ 라이센스 영향 — Oracle DB EE·MS SQL EE·VMware vCF Per-Core, SKU 선택이 비용 수억 좌우
- ⑥ BOM 확정 — 증설·HA 여유 20~30% 마진 포함, 향후 3년 증가율 반영
⚠️ 흔한 실수
- ⑤ 단계 생략 — 같은 성능이면 코어 적고 클럭 높은 SKU가 라이센스비 수억 절감
- "코어 많을수록 좋다" 논리 금물 — Per-Core 라이센스 시 비용 폭증
라이센스가 SKU를 결정 — Oracle DB EE·MS SQL EE·VMware vCF가 모두 Per-Core 라이센스라, 같은 성능이면 코어 수가 적고 클럭이 높은 SKU (예: Xeon Gold 6444Y 16C @ 4.0 GHz)가 라이센스비를 수억 원 단위로 줄인다. 산정 6단계 ⑤에서 SKU가 뒤집히는 사례 잦음 — 자세한 라이센스 비교는 Session 3 ## CPU 산정 (라이센스) 참조.
Memory 산정 — Working Set·OS 캐시·DB 버퍼풀·세션
🧮 OS·App 메모리
- OS 기본 — Linux 2~4GB·Windows 4~8GB
- JVM Heap — 동접 × 세션메모리 (1MB~수MB)
- JVM Non-Heap + Native = Heap × 0.5~1.0
- 컨테이너 베이스 이미지 — Alpine 50MB·Ubuntu 200MB
- Working Set — 평소 활성 영역 (RSS)
- OS Page Cache — 파일 IO 캐시
🧮 DB 메모리
- Oracle SGA — 데이터 크기의 20~50%
- Oracle PGA — 동시 세션 × 5~20MB
- MySQL InnoDB Buffer Pool — 데이터의 50~70%
- PostgreSQL shared_buffers — 시스템의 25%
- MSSQL Buffer Pool — 가용 메모리의 70~80%
📊 산정 예시 (LMS WAS)
- 동접 2,000명, 세션 4MB
- Heap = 2,000 × 4MB = 8GB
- Non-Heap + OS = 8GB × 1.5 = 12GB
- 컨테이너 2개 운영 → 노드당 24GB
- 마진 30% → 32GB RAM
📊 산정 예시 (PostgreSQL DB)
- 데이터 200GB, shared_buffers 25% → 50GB
- work_mem × 동접 100 × 64MB = 6.4GB
- effective_cache_size = 시스템의 50% = 100GB
- 마진 → 128GB RAM 권장
격언: "DB는 메모리가 곧 성능" — RAM 부족하면 SAN 성능 무관하게 응답 지연.
IOPS 산정 — Random vs Sequential · Block · Queue Depth
⚡ IOPS 핵심 파라미터
- Block Size — 4KB(DB)·64KB(가상화)·1MB(백업)
- R/W 비율 — OLTP 70:30·DW 95:5·로그 0:100
- Random vs Sequential — Random이 5~50배 부담
- Queue Depth — 1·8·32 (높을수록 처리량 ↑)
- Latency — μs~ms (NVMe < 0.1ms, HDD 5~10ms)
🧮 산정 공식
- DB IOPS = TPS × (트랜잭션당 IO 수)
- 일반 OLTP 트랜잭션 — 10~30 IO/TX
- 백업 IOPS = 데이터량 ÷ 백업 윈도우
- 로그 IOPS = TPS × 1~3 (Sequential)
📊 매체별 IOPS·Latency
| 매체 | Random R IOPS | Latency |
|---|---|---|
| HDD 7.2K SATA | 75~100 | 8~12ms |
| HDD 10K SAS | 130~150 | 4~7ms |
| HDD 15K SAS | 175~200 | 3~5ms |
| SSD SATA | 50,000~100K | 0.1~0.5ms |
| SSD SAS | 100K~200K | 0.1ms |
| NVMe Gen 4 | 500K~1M | <0.1ms |
| NVMe Gen 5 | 1M~3M | <0.05ms |
📐 예시
- 100 TPS × 20 IO/TX = 2,000 IOPS 필요
- 마진 ×2 = 4,000 IOPS
- HDD로 충당 = 40+ 디스크 / NVMe 1대로 충분
네트워크 대역 — Concurrent × bps · 피크 마진
🌐 산정 공식
- 응용 대역 = TPS × (트랜잭션당 페이로드 bytes) × 8 (bit)
- 세션 동시 대역 = 동접 × 평균 bps
- 클라이언트 ↔ Web = 평균 페이지 1~3MB × TPS
- Web ↔ WAS = 200KB ~ 1MB × TPS
- WAS ↔ DB = 50~200KB × TPS
📊 표준 대역
- 사무실 단말 — 1Mbps 평균, 10Mbps 피크
- VDI — 200Kbps~5Mbps (PCoIP·Blast)
- Voice (VoIP) — 80~100Kbps/세션
- 영상 회의 HD — 1~2Mbps/세션
- 4K 스트리밍 — 25Mbps
🔗 백본·서버 NIC
- 사무실 액세스 스위치 — 1Gbps × 포트
- 분산층 업링크 — 10Gbps
- 코어 스위치 — 40/100Gbps
- 서버 NIC 표준 (2026) — 25Gbps (2장 LACP)
- GPU 클러스터 — 100Gbps RoCE / IB NDR 400G
📐 산정 예시
- 100 TPS, 페이지 평균 500KB
- 100 × 500KB × 8 = 400 Mbps 응용 대역
- 피크 마진 × 3 = 1.2 Gbps
- → 10G NIC + 25G 백본 충분
스토리지 용량 — 저장량 · 증가율 · 보관기간 · 압축
🧮 운영 용량 공식
- 운영 = 현재 + (일증가 × 365일 × 5년)
- 인덱스 가산 — 데이터의 30~50%
- 임시·로그 — 데이터의 20~30%
- 메타데이터 — 5~10%
- 여유 마진 — 30~50%
- 운영 디스크 사용률 70% 이내 유지
🧮 백업 용량 공식
- 백업 = (Full × 세대) + (Incremental × 일수)
- 압축률 — 일반 데이터 2~3:1, DB 4~5:1
- 중복제거 — 백업 10~20:1
- WORM/Object Lock — 추가 5~10%
📐 산정 예시 (학사 정보 DB)
- 현재 200GB
- 일증가 500MB → 5년 = 900GB
- 인덱스 +50% → 1.35TB
- 임시·로그 +30% → 1.75TB
- 마진 +50% → 2.5TB 운영
📐 백업 산정
- 일 Full 5세대 + 30일 Incremental
- = (1.35TB × 5) + (50GB × 30) = 8.25TB
- 압축 2:1 + Dedup 5:1 → 0.8TB 실제
- 마진 +50% → 1.2TB 백업
📐 비정형 (영상·이미지)
- 일증가 폭증 위험 — 별도 산정
- Tiering (Hot·Warm·Cold) 설계
산정 사례 — 동접 10,000 LMS 5년 운영
📥 입력값
- MAU 100,000명·DAU 30,000명·동접 피크 10,000명
- 트랜잭션 — 강의 시청·과제·시험
- 사고시간 — 평균 15초 (LMS 표준)
- 응답시간 — p95 2초
- 가용성 99.9% (월 다운 43분)
- 데이터 — 강의 영상 + 학습 로그
- 보관기간 5년
🧮 산정 결과
- TPS — 10,000 × (1/15) = 667 TPS
- 피크 마진 3배 = 2,000 TPS
- CPU — 2,000 × 40ms ÷ 0.5 = 160 vCPU
- 노드 분산 (32C × 10대) + HA = 12대
🧮 메모리·스토리지·NW
- WAS Memory — 10,000 × 4MB = 40GB Heap × 12노드 = 64GB/노드
- DB Memory — 200GB 데이터 × 50% = 100GB Buffer + 마진 = 256GB RAM
- DB IOPS — 2,000 × 15 IO = 30,000 IOPS → NVMe 필수
- 스토리지 (영상) — 일증가 50GB × 5년 = 90TB + 마진 → 120TB Object
- 네트워크 — 영상 1Mbps × 10,000 = 10Gbps → 25G NIC × LACP
📋 BOM
- App — 32C/64GB × 12대 (Web/WAS)
- DB — Patroni 3 노드 (32C/256GB/4TB NVMe)
- Object — Ceph 120TB (Erasure 8+3)
- NW — Spine 100G × 4, Leaf 25G × 12
산정 사례 — 동접 500 학사 행정 시스템
📥 입력값
- MAU 2,000명·DAU 800명·동접 500명 (수강신청 기간 5,000명 폭증)
- 트랜잭션 — 학적·성적·등록
- 사고시간 평균 30초·수강신청 1초
- 응답시간 p95 3초
- 가용성 99.9%
- 데이터 50GB·일증가 20MB
🧮 평시 산정
- TPS = 500 × (1/30) = 17 TPS
- 피크 마진 ×3 = 50 TPS
- CPU = 50 × 40ms ÷ 0.5 = 4 vCPU → 8C 권장
🧮 수강신청 폭증 산정
- 동접 5,000 × (1/1) = 5,000 TPS (10배+ 폭증)
- 5,000 × 40ms ÷ 0.6 = 333 vCPU
- → 평시 분리 운영 권장 (Auto-Scale 또는 분리 인스턴스)
📋 BOM
- WAS — 평시 16C/32GB × 2대 + 폭증 시 32C × 8대 (Cloud Burst)
- DB — Active-Standby PostgreSQL 16C/64GB
- 스토리지 — 1TB NVMe + 백업 NAS 4TB
- NW — 10G NIC
🎙️ 결정 포인트
- 수강신청 폭증 = 별도 인스턴스 운영 (메인 분리)
- 또는 Cloud Burst (하이브리드)
- 평소 자원 낭비 방지
PART D
성능 도구·부하 테스트 — 측정 없이 산정 없다
산정은 가정 + 공식 + 실측 검증. 부하 테스트 도구 없이 산정은 추측에 불과.
부하 테스트 도구 — 애플리케이션 부하
🛠️ Java/Heavy
- Apache JMeter — 가장 흔한 표준, GUI·CLI, 플러그인 풍부
- Gatling — Scala 기반, 코드형 시나리오, 리포트 미려
- Tsung — Erlang 기반, 대규모 분산
🛠️ 경량·CLI
- wrk / wrk2 — C, 초경량
- hey — Go, Apache Bench 후속
- vegeta — Go, 일정 RPS 테스트
- Apache Bench (ab) — 단순 벤치 표준
🛠️ 현대·DevOps
- k6 (Grafana) — JavaScript, 모던 표준, CI 통합
- Locust — Python, 분산 부하, 직관적
- Artillery — Node.js, YAML 시나리오
- Drill — Rust, HTTP 부하
🛠️ DB·내부
- HammerDB — TPC-C·TPC-H 표준 DB 부하
- sysbench — MySQL·PostgreSQL 표준
- pgbench — PostgreSQL 전용
- fio — IO 직접 부하 (스토리지)
- iozone — 파일시스템 IO
🛠️ 상용
- LoadRunner (OpenText·구 HPE)
- NeoLoad (Tricentis)
- BlazeMeter (Perforce, JMeter as a Service)
- LoadView (Dotcom-Monitor)
🎯 선택 기준
- 개발팀 친화 — k6·Gatling (코드)
- 표준·교과서 — JMeter
- 대규모 — Tsung·Locust
- DB 단독 — HammerDB·sysbench
- CI/CD 통합 — k6 (CLI·Cloud)
시스템 모니터링 CLI — perf · sar · iostat · vmstat · top
🔍 CPU·프로세스
- top / htop / btop — 실시간 프로세스
- pidstat — PID별 상세
- mpstat — CPU 코어별
- perf — 커널 프로파일링
- strace / ltrace — 시스템콜·라이브러리
- uptime / w — 부하 평균
💾 메모리
- free -h — 사용량
- vmstat 1 — VM·스왑·CPU·IO
- smem — 프로세스별 PSS
- slabtop — 커널 슬랩
- /proc/meminfo — 상세
💿 IO·디스크
- iostat -x 1 — 디스크 통계 (await·svctm·util)
- iotop — 프로세스별 IO
- dstat — 통합 (CPU·IO·NW)
- blktrace — 블록 IO 추적
- fio — IO 부하 도구
- df / du / ncdu — 사용량
🌐 네트워크
- ss / netstat — 소켓
- iftop / nload — 인터페이스
- nicstat — NIC 상세
- ethtool — NIC 설정·통계
- tcpdump / tshark — 패킷
- ip / ifconfig — 인터페이스
📊 통합·연속 측정
- sar (sysstat) — 모든 자원 시계열 기록·재생
- collectl — 통합 측정
- dstat — 실시간 통합
- atop — 프로세스 + 시스템
- glances — Python 통합 대시보드
- nmon (AIX·Linux) — 시계열 리포트
🎙️ TA의 사용 습관
- 장애 시 — top/iostat/vmstat 3종 우선
- 상시 — sar로 시계열 저장
- GUI 분석 — kSar·collectl reader
네트워크 도구 — iperf3 · Wireshark · MTR · tcpdump
🌐 처리량·연결
- iperf3 — TCP/UDP 처리량 측정 (대역폭 표준)
- ntopng / nProbe — NetFlow·sFlow 시각화
- bmon — 대역폭 실시간
🕵️ 패킷 분석
- Wireshark / tshark — 패킷 분석 표준
- tcpdump — CLI 패킷 캡처
- ngrep — grep 스타일 패킷 검색
- httpry — HTTP 트래픽 전용
🛤️ 경로·연결
- ping — ICMP 도달
- traceroute / tracepath — 경로 추적
- MTR (My Traceroute) — ping + traceroute 통합
- mtr --report — 지속 모니터링
- dig / nslookup — DNS 조회
- nmap — 포트 스캔 (TA 진단 용)
🎙️ TA의 진단 시퀀스
- ping — 도달 여부
- MTR — 경로 지연·손실
- iperf3 — 실측 대역폭
- tcpdump → Wireshark — 페이로드 분석
부하 테스트 시나리오 — 5종 표준 패턴
📈 테스트 종류
- Smoke Test — 최소 부하로 동작 확인 (5~10분)
- Load Test — 예상 평균 부하 (1~2시간)
- Stress Test — 한계까지 증가 (점진 증가)
- Spike Test — 갑작스러운 폭증 (이벤트 대응)
- Soak Test — 장시간 (8~24시간, 메모리 누수)
⏱️ 워크플로 구간
- Ramp-up — 부하 점진 증가 (10~20분)
- Plateau — 목표 부하 유지 (30분~수시간)
- Ramp-down — 부하 감소
- Recovery — 시스템 복귀 관찰
📊 측정 지표
- TPS·RPS — 처리량
- 응답시간 — 평균·p50·p95·p99
- 에러율 — 5xx·timeout·connection refused
- 자원 사용률 — CPU·Mem·IO·NW
- 포화점 (Knee) — 응답시간 급증 지점
⚠️ 흔한 실수
- 테스트 환경 ≠ 운영 환경 — 결과 신뢰성↓
- 외부 의존 미목업 — 실제 NW·DB 부하 거의 없음
- 단일 시나리오만 — 복합 시나리오 누락
- 로컬 부하기 — NIC 병목, 분산 부하기 필요
성능 튜닝 — 5단계 사이클
🔍 튜닝 대상 계층
- App 코드 — 알고리즘·캐싱·async
- JVM — Heap·GC·MetaSpace
- DB — 인덱스·쿼리·풀
- OS — sysctl·ulimit·sched
- HW — CPU 코어·NIC·디스크 매체
⚠️ 튜닝 원칙
- 한 번에 하나만 변경 — 효과 측정 가능
- Baseline 확보 — 비교 기준
- 변경 사항 문서화 — 롤백 가능
- Premature Optimization 회피 — 측정 후 튜닝
- 80/20 법칙 — 병목 20%가 80% 효과
PART E
관찰성 3대 축 — Metrics · Logs · Traces
모니터링은 "정해진 것을 본다", 관찰성은 "모르는 것을 캐낼 수 있다".
Observability vs Monitoring — 무엇이 다른가
📊 Monitoring (전통)
- 사전 정의된 메트릭 수집
- 임계치 기반 알람 (CPU > 80%)
- What's wrong? (무엇이 문제인가)
- Known unknowns 대응
- 대시보드 중심
- 예: Zabbix·Nagios·PRTG
🔬 Observability (현대)
- 시스템 상태를 외부에서 추론 가능
- 임의 질문에 답할 수 있음 ("왜 이 요청만 느리지?")
- Why? (왜 그런가)
- Unknown unknowns 대응
- 탐색 중심 (Drill-down)
- 3대 축: Metrics · Logs · Traces
관찰성은 모니터링의 상위 개념 — 모니터링이 가능한 시스템 + 임의 질문에 답할 수 있는 시스템.
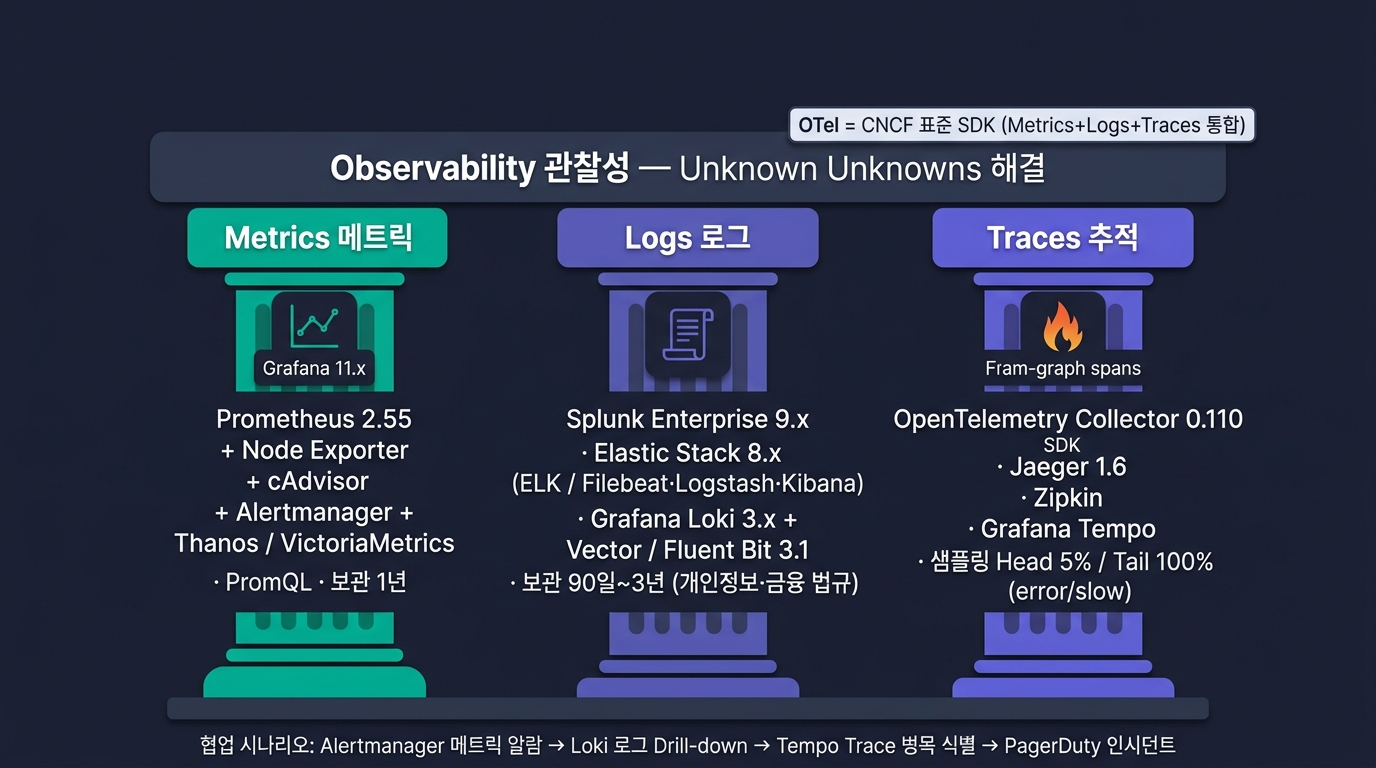
관찰성 3대 축 (삽화)
Metrics · Logs · Traces — 역할 분담
📈 Metrics (메트릭)
- 숫자 시계열 — 시간별 값
- 예: CPU% · 메모리 · TPS · 응답시간 · 에러율
- 집계·평균·트렌드
- 저장 효율 — 매우 높음 (시계열 DB)
- 보관 — 장기 (수개월~연)
- 알람·SLO 지표 산출 기반
- 도구: Prometheus·VictoriaMetrics·InfluxDB·Datadog
📜 Logs (로그)
- 이벤트 기록 — 텍스트·JSON
- 예: 액세스 로그·에러·감사·디버그
- 특정 시점 상세 정보
- 저장 효율 — 낮음 (텍스트 풍부)
- 보관 — 법규 단기·중기 (3개월~3년)
- 누가·언제·무엇 검색
- 도구: ELK·Loki·Splunk·Graylog
🔗 Traces (분산 추적)
- 요청 흐름 추적 — Span 트리
- 예: 단일 요청이 거친 모든 서비스·DB·API
- MSA·분산 시스템의 핵심
- 저장 효율 — 중간 (샘플링)
- 보관 — 단기 (수일~주)
- 병목 위치·연쇄 장애 분석
- 도구: OpenTelemetry·Jaeger·Zipkin·Grafana Tempo
3축 협업 예: Metrics 알람("응답시간 급증") → Logs 검색("어떤 요청이?") → Traces 분석("어디서 지연?")
NMS — Network Management System 카탈로그
🛠️ 오픈소스·표준
- Zabbix — 한국 표준 오픈소스, 강력·복잡
- Nagios / Nagios XI — 전통 표준
- LibreNMS — Observium 후속, SNMP 자동발견
- Observium — 무료/상용 분리
- Cacti — RRDtool 기반 그래프
- Icinga — Nagios 포크, 모던 UI
- Checkmk — 오픈소스 + Enterprise
💼 상용
- SolarWinds NPM — 글로벌 표준
- PRTG (Paessler) — 센서 단위 라이센스
- ManageEngine OpManager — 한국 점유율 높음
- LogicMonitor — SaaS·자동발견
- Datadog Infrastructure — SaaS 종합
- Auvik — MSP 친화
- Cisco DNA Center — Cisco 통합
🎙️ TA의 결정
- 공공·SI 표준 — Zabbix · SolarWinds
- 클라우드 — Datadog · LogicMonitor
- 소규모 — PRTG · LibreNMS
🎨 이미지 프롬프트: "Editorial side-by-side dashboard mockup illustration on dark navy background — left half labeled 'Zabbix 7.0 LTS Dashboard (Global view)' showing the classic Zabbix UI with a left-side host tree expanded ('Templates / Linux by Zabbix agent / Apache by HTTP / PostgreSQL 16 by Zabbix agent' with 187 hosts), top-center search bar and a tab strip 'Global view · Geomap · System status', main area shows a 'Problems' table with severity colors (Disaster red 'pg-prod-01: replication lag > 60s', High orange 'web-04: filesystem /var > 90%', Average yellow 'lb-01: CPU > 70%', Warning teal, Info blue), four small graphs in a 2x2 grid: CPU 'avg(system.cpu.util) 5m' / Memory 'vm.memory.util' / Disk 'vfs.fs.size /var pused' / Network 'net.if.in eth0' with multi-host series, footer '4,217 items polled · 187 hosts · Zabbix server 7.0.4'; right half labeled 'Nagios XI 2024 Dashboard' showing the green/red service status grid with host names (db-prod-01, db-prod-02, web-01..web-08, lb-prod-01) and check states columns 'PING/HTTP/SSH/Disk/Load' (OK green / WARNING yellow / CRITICAL red), a hosts up/down donut chart top-right '184 UP · 2 DOWN · 1 PENDING', a tactical overview strip 'Outages 2 · Unhandled Problems 5 · Acknowledged 3', a small SNMP trap log strip; thin teal vertical divider; clean editorial UI mockup style, teal #00b894 and purple #6c5ce7 accents, 16:9"
📸 NMS 대시보드 reference - Zabbix 공식 데모 — zabbix.com/demo - Nagios XI Dashboard — nagios.com/products/nagios-xi - SolarWinds NPM 스크린샷 — solarwinds.com/network-performance-monitor - PRTG 데모 — paessler.com/prtg/demo - ManageEngine OpManager — manageengine.com/network-monitoring
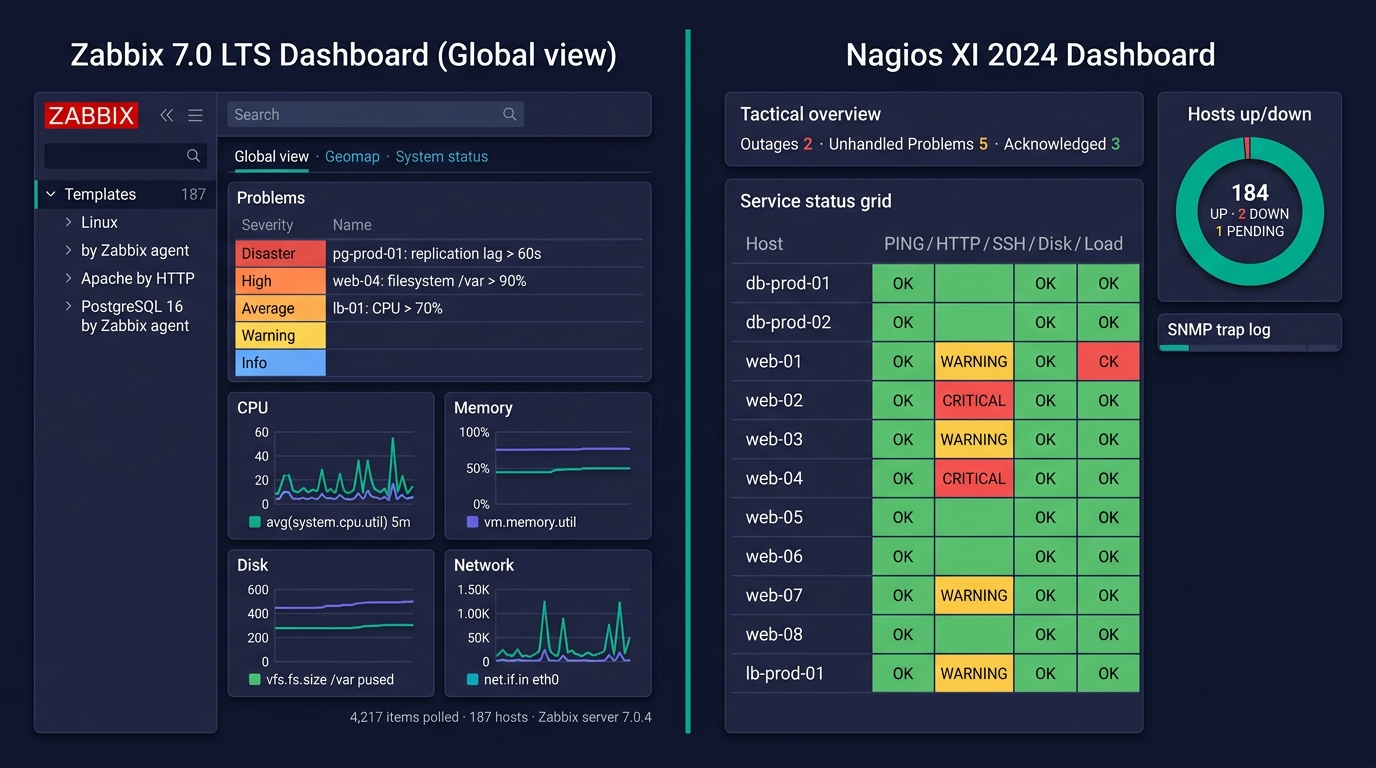
NMS — Network Management System 카탈로그
APM — Application Performance Monitoring
🇰🇷 한국 APM
- Pinpoint — Naver 오픈소스, Java 강점
- Scouter — LG CNS 오픈소스, 한국 SI 표준
- Jennifer — 제니퍼소프트 상용, 한국 1위 점유율
- WhaTap — SaaS 형태 한국 APM
🌍 글로벌 상용 APM
- New Relic — SaaS 표준
- AppDynamics — Cisco 인수, 엔터프라이즈
- Datadog APM — 종합 플랫폼
- Dynatrace — AI 기반 자동 분석 (Davis AI)
- Instana — IBM, 자동 발견
- Splunk APM (Observability) — Splunk 통합
📊 APM 측정 항목
- 응답시간 — 평균·p95·p99
- TPS·에러율
- 트랜잭션 분해 — 단계별 시간
- DB 쿼리 분석 — Slow Query
- 외부 API 호출 — 지연 분포
- JVM — Heap·GC·Thread·CPU
- 사용자 경험 (RUM) — 실제 브라우저 측정
- Synthetic Monitoring — 가짜 사용자 시뮬레이션
🎙️ TA의 결정
- 공공·금융 (한국) — Jennifer · Scouter
- 신규 SaaS — Datadog · New Relic
- 자동화 강점 — Dynatrace
- 오픈소스 — Pinpoint + Elastic APM
🎨 이미지 프롬프트: "Editorial APM console mockup illustration on dark navy background — left half labeled 'Pinpoint 3.x APM (Naver, oss)' showing the signature transaction servermap (Service Tree) with circular service nodes labeled 'USER → NGINX-LB → tomcat-web (Tomcat 10.1) → was-api (Spring Boot 3.3) → postgres-primary (PG16) → External Pay API (KG이니시스)', nodes connected by directional arrows with TPS/avg-elapsed labels ('1,245 TPS / 412ms', '980 TPS / 380ms'), node sizes proportional to traffic and a red border + warning triangle on the slow
postgres-primarynode showing 'Slow query rate 8.2%'; below it a scatter chart of response times (x=last 5min, y=elapsed ms 0~5000) with thousands of green dots and several red dots clustered around 3,500ms marking slow transactions, side panel 'Real-time Active Thread 23 · TPS 1,245 · Heap 6.4/8.0 GB · Old GC 187ms'; right half labeled 'Scouter Suite 2.x APM (LG CNS, oss) + Jennifer 6 sidebar' showing a real-time XLog scatter chart (x=time, y=elapsed ms 0~10s) with thousands of green dots and a few red outliers clustered at 6s, plus a top metric bar 'TPS 423 · Active 17 · Heap 64% · CPU 58% · GC count 12/min · DB Pool 87%', a small lower panel 'Stack Sample of slowest TX (Thread-42): java.sql.PreparedStatement.executeQuery() at OrderRepository.findRecent() 4,823ms', a Jennifer 6 X-View 비교 strip on the right showing same workload but on Jennifer console; clean editorial UI mockup style, teal #00b894 and purple #6c5ce7 accents, 16:9"
📸 APM 콘솔 reference - Pinpoint (Naver) — github.com/pinpoint-apm/pinpoint (스크린샷 풍부) - Scouter (LG CNS) — github.com/scouter-project/scouter - Jennifer (제니퍼소프트) — jennifersoft.com - Datadog APM Service Map — docs.datadoghq.com/tracing/services/service_map - Dynatrace Smartscape — dynatrace.com/platform
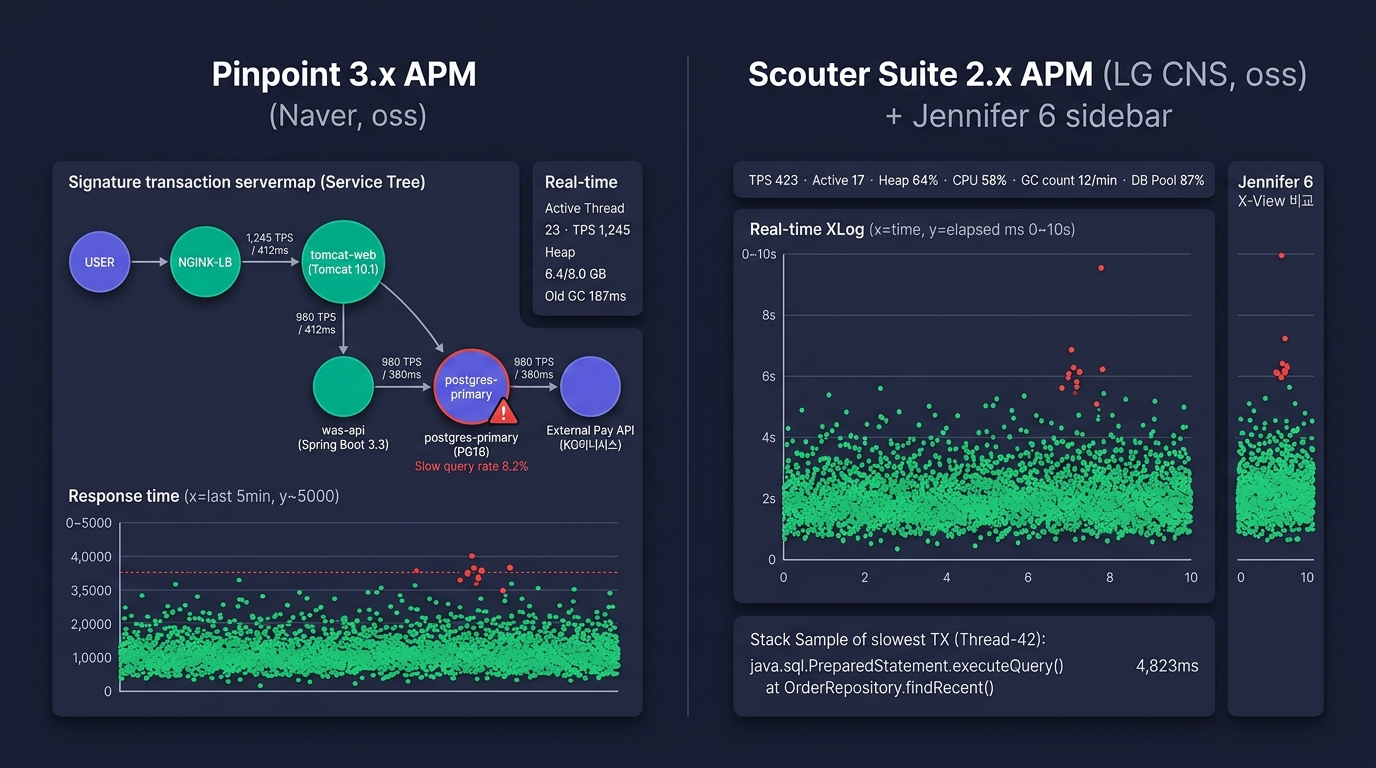
APM — Application Performance Monitoring
로그 통합 — ELK · Splunk · Loki · Fluentd
🟢 ELK Stack (Elastic Stack)
- Elasticsearch — 검색 엔진 (Lucene 기반)
- Logstash — 수집·가공 파이프라인
- Kibana — 대시보드·검색 UI
- Beats (Filebeat·Metricbeat) — 경량 수집기
- 무료 → Open Distro · OpenSearch (AWS Fork)
🟪 상용 로그
- Splunk Enterprise / Cloud — 압도적 표준, 비싼 라이센스
- Sumo Logic — SaaS 표준
- Graylog — 오픈/상용
- Datadog Logs — 통합 플랫폼
🟦 수집기·파이프라인
- Fluentd — CNCF, Ruby
- Fluent Bit — 경량, C
- Vector — Rust, 빠름
- Logstash — Elastic
- rsyslog · syslog-ng — 전통 syslog
🆕 클라우드 네이티브
- Loki (Grafana) — Prometheus 스타일 로그, 저렴
- Tempo (Grafana) — Trace 통합
- AWS CloudWatch Logs
- GCP Cloud Logging
- Azure Monitor Logs
2026 추세: 비용 부담 큰 ELK·Splunk → Loki + Grafana 또는 Vector + ClickHouse 이전.
🎨 이미지 프롬프트: "Editorial log-tool dashboard mockup illustration on dark navy background — left half labeled 'Splunk Enterprise 9.x — Search & Reporting' showing a dark-theme SPL search bar with full query
index=web sourcetype=access_combined status>=500 earliest=-1h | stats count by host status | sort -countand the time-picker 'Last 60 minutes', below a results table (rows: web-04 / 500 / 4,182 · web-07 / 502 / 1,247 · web-04 / 504 / 318) + a bar chart of error counts by host with web-04 spiking, sidebar shows 'Selected Fields: host, status, uri_path, response_time, useragent' and 'Interesting Fields: src_ip, bytes', top-right indexed volume meter '420 GB/day · 18 days retention' and a small Splunk green-orange logo; bottom strip a hand-typedlogcli query '{job=\"postgres\"} |= \"ERROR\" |= \"deadlock\"' --since=1h --limit=200(Grafana Loki CLI) showing matched lines stream; right half labeled 'Kibana 8.x Discover (Elastic Stack 8.x ELK)' showing the green-on-dark Kibana interface with a left field-list panel (host, agent, status, response_time, kubernetes.pod_name, trace.id) and a right hits panel listing 5xx errors with JSON expansion (timestamp, _source, http.response.status_code: 503, error.message: 'upstream connect timeout', service.name: 'payment-svc', trace.id: 'a3f...'), top KQL barhttp.response.status_code >= 500 and kubernetes.namespace : \"prod\", top-right histogram of hits per 1m over last 60m with a tall red spike at -12min; clean editorial UI mockup style, teal #00b894 and purple #6c5ce7 accents, 16:9"
📸 로그 통합 콘솔 reference - Splunk Search & Reporting — splunk.com/en_us/products/splunk-enterprise.html - Kibana Discover — elastic.co/kibana - Grafana Loki + Explore — grafana.com/oss/loki - Graylog — graylog.org - Datadog Logs Explorer — docs.datadoghq.com/logs
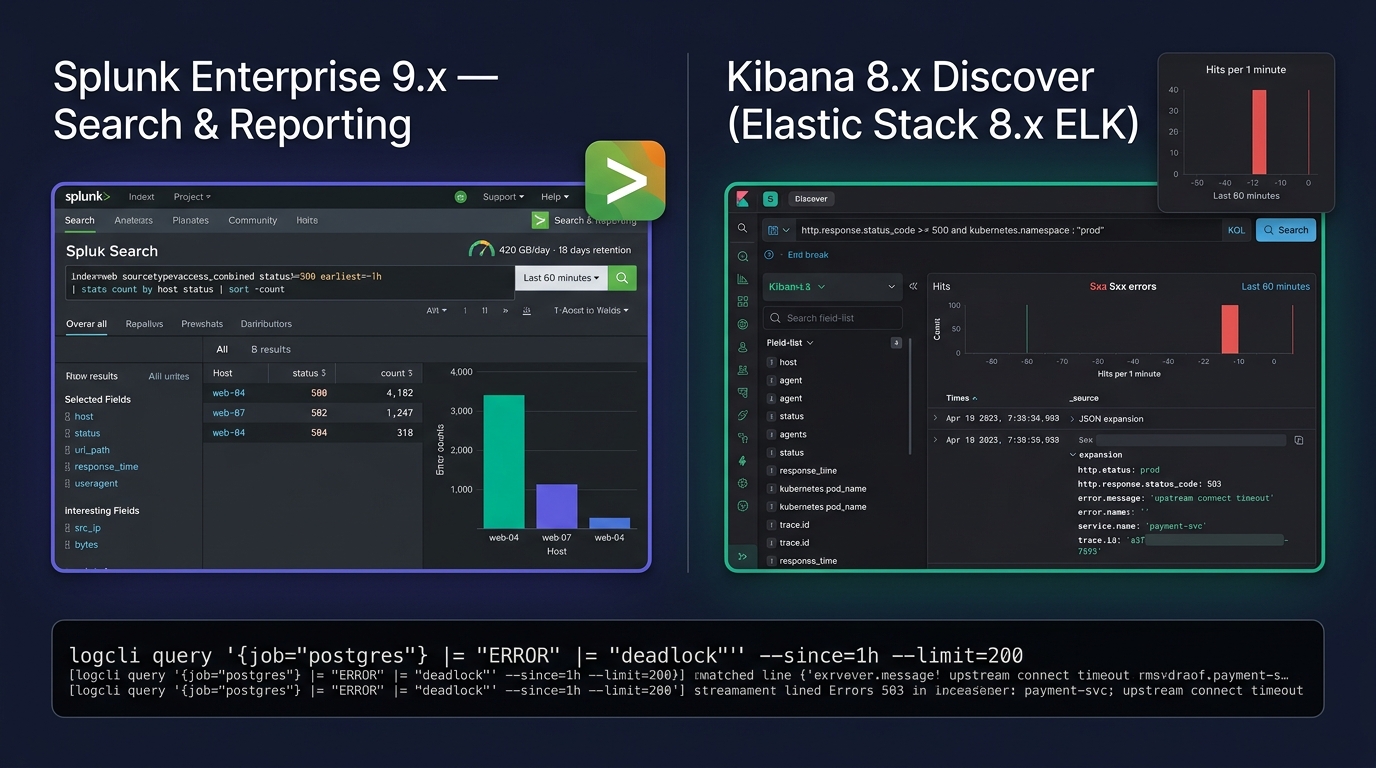
로그 통합 — ELK · Splunk · Loki · Fluentd
메트릭 — Prometheus · Grafana · InfluxDB · Thanos
📊 Prometheus 생태계
- Prometheus — CNCF, Pull 방식 표준
- Node Exporter — 시스템 메트릭
- cAdvisor — 컨테이너
- Pushgateway — 배치 작업
- Alertmanager — 알람 라우팅·중복 제거
- PromQL — 표준 쿼리 언어
📊 장기 저장·확장
- Thanos — 멀티 클러스터·장기 저장
- Cortex — 멀티 테넌시·장기 저장
- Mimir (Grafana) — Cortex 후속
- VictoriaMetrics — 고성능 대안
- M3DB (Uber) — 대규모 분산
📊 시계열 DB (TSDB)
- InfluxDB / InfluxDB Cloud
- TimescaleDB — PostgreSQL Extension
- OpenTSDB — Hadoop 기반
- Graphite — 전통 표준
- QuestDB — 신규 고성능
🖼️ 시각화·대시보드
- Grafana — 압도적 표준
- Kibana — Elastic 통합
- Chronograf — InfluxDB 통합
- Datadog 대시보드
🎙️ TA의 결정
- 표준 조합 — Prometheus + Grafana + Alertmanager
- 장기 보관 — Thanos · VictoriaMetrics
- 상용 SaaS — Datadog · New Relic
🎨 이미지 프롬프트: "Editorial Grafana 11.x dashboard mockup illustration on dark navy background — full-screen Grafana 'Node Exporter Full (rev 39)' dashboard layout with 8 panels arranged in a 4x2 grid, top time-picker 'Last 6 hours · refresh 30s', datasource 'Prometheus 2.55 (Thanos sidecar)', variable dropdown 'job=node · instance=db-prod-01..db-prod-03' visible: top row 'CPU Usage % (stacked area chart, multi-host, PromQL
100 - (avg by (instance) (rate(node_cpu_seconds_total{mode=\"idle\"}[5m])) * 100), current 68%, 70% margin line drawn)', 'Memory Used / Free (gauge + line, 75% margin line, current 62/96 GB)', 'Disk I/O Read/Write MB/s (line, sda 412/187, nvme0n1 1,820/940)', 'Network bps in/out (line, 8.2/3.1 Gbps with 70% margin line on 10Gbps NIC)'; bottom row 'Disk Usage by mountpoint (table with progress bars: / 42% · /var 78% near 80% margin · /pgdata 64% · /backup 51%)', 'Load Average 1/5/15 (line, 12.4/11.8/10.2 on 32-core host)', 'Filesystem Inode Usage (percent bars per mount)', 'Top Processes by CPU (table: postgres 18.2% · patroni 4.1% · node_exporter 0.4% · prometheus 0.2%)'; top-right shows a red 'Alerting' badge with 2 firing alerts 'HighCPUUsage db-prod-01 for 7m', 'DiskFull /var web-04 for 12m'; left sidebar shows the Grafana orange-flower logo, folder tree 'Observability / Infra / Node Exporter Full · DB · K8s · LB · App'; bottom strip CLI overlaypromtool check rules /etc/prometheus/alerts.yml'SUCCESS: 47 rules found' andpromtool query instant http://localhost:9090 'rate(node_cpu_seconds_total[5m])'; clean editorial UI mockup style, teal #00b894 and purple #6c5ce7 accents, 16:9"
🎨 이미지 프롬프트: "Editorial console mockup illustration on dark navy background — top half labeled 'Prometheus Alertmanager 0.27 UI (Alerts view)' showing the silenced/active alerts list grouped by route, with group labels chips (
job=node,severity=critical,cluster=prod-seoul,team=infra), filter pills at top 'severity!=info team=infra', three currently firing alert cards 'HighCPUUsage instance=db-prod-01 (firing 7m, value 92%)', 'DiskFull instance=web-04 mountpoint=/var (firing 12m, value 94%)', 'ServiceDown job=patroni-exporter instance=pg-03 (firing 2m)', each with 'Silence' / 'Inhibit' / 'Source' buttons, left nav 'Alerts · Silences · Status · Inhibitions', top-rightReload Configbutton; bottom half labeled 'PagerDuty Incident View (PD Modern UI)' showing a red P1 incident card 'INC-4823 · PROD-DB-01 DiskFull · /var 94% · Triggered 18:42 KST' with timeline events 'Triggered (Alertmanager webhook) 18:42 → Acknowledged by 박수현 18:44 → Note: log rotate 수동 실행 18:46 → Escalated to 이지훈 (escalation policy: Infra L2 → L3) 18:52 → Resolved 19:03', responder avatars on a side panel, on-call schedule strip on the right with rotating engineer avatars '이번 주 박수현 → 다음 주 이지훈 → 그 다음 윤서아' (Primary / Secondary lanes), small Slack #incidents channel preview at bottom 'PagerDuty Bot: INC-4823 acknowledged'; thin teal horizontal divider; clean editorial UI mockup style, teal #00b894 and purple #6c5ce7 accents, 16:9"
📸 메트릭·알람·APM 대시보드 reference - Grafana 공식 dashboards — grafana.com/grafana/dashboards - Prometheus Alertmanager UI — prometheus.io/docs/alerting/latest/alertmanager - PagerDuty Incident Console — pagerduty.com/platform/incident-management - Datadog APM Service Map — docs.datadoghq.com/tracing/services/service_map - Dynatrace Smartscape (Davis AI) — dynatrace.com/platform - New Relic One — newrelic.com/platform - VictoriaMetrics — victoriametrics.com
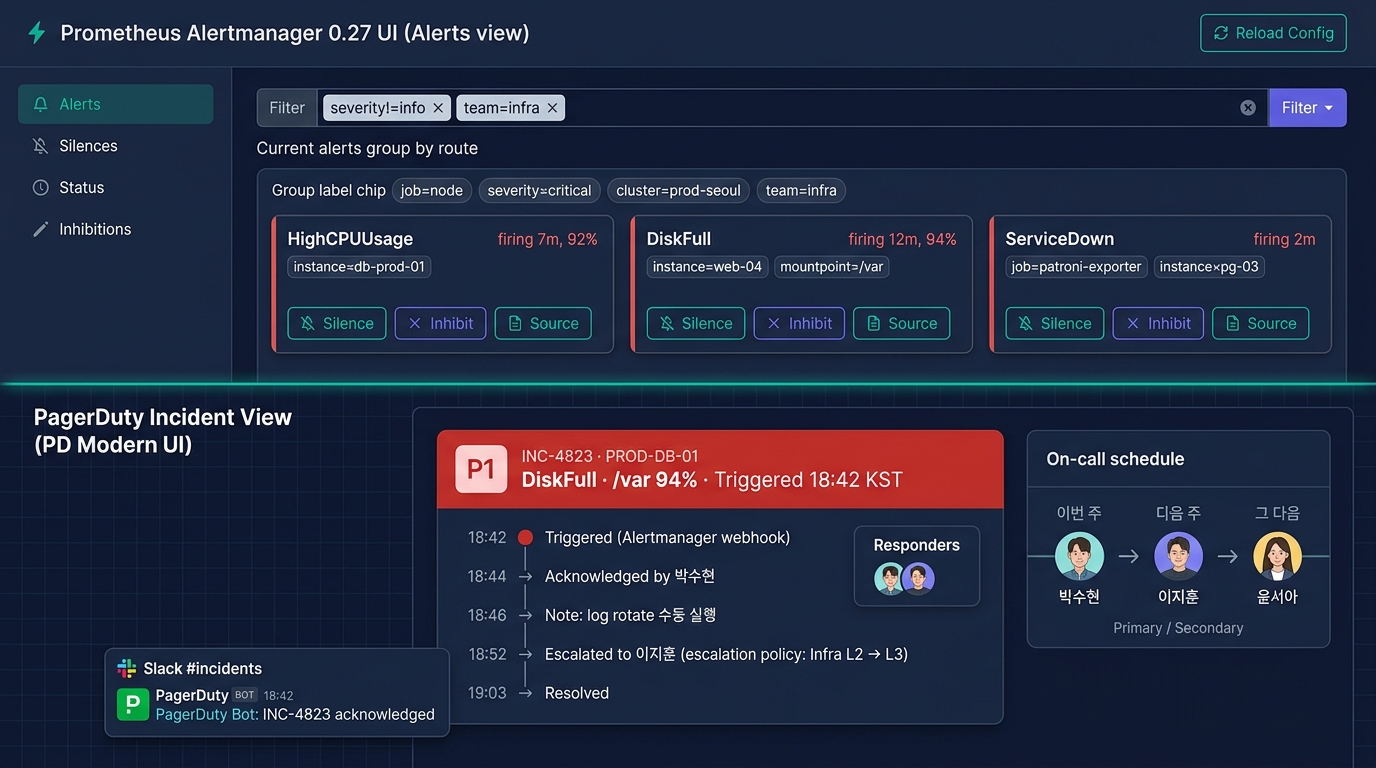
메트릭 — Prometheus · Grafana · InfluxDB · Thanos
알람·On-Call — PagerDuty · OpsGenie · 알람 피로
🚨 알람 도구
- PagerDuty — 글로벌 표준, on-call 로테이션
- OpsGenie (Atlassian) — Jira 통합
- Splunk On-Call (구 VictorOps)
- Squadcast · Better Stack · Grafana OnCall
- Slack·Teams·Webhook — 가벼운 통보
- 카카오톡·SMS·전화 — 한국 NOC 운영
🔁 라우팅·중복 제거
- Alertmanager (Prometheus) — Group·Inhibit·Silence
- PagerDuty Event Rules
- 에스컬레이션 정책 — 5분 미응답 → 다음 사람
😴 알람 피로 (Alert Fatigue)
- 알람이 너무 많으면 무시·번아웃
- 진짜 장애 알람 놓침
- 사라져야 할 알람:
- 자동 회복하는 일시 장애
- 임계치 너무 낮음
- 중복·반복
- 실행 불가 (Actionable 아님)
🎯 알람 설계 원칙
- Actionable — 받은 사람이 행동 가능
- 사람 알람 + 자동 복구 분리
- SLO 기반 — Error Budget 소진 시 알람
- 심각도별 라우팅 — P1 즉시·P3 다음날
PART F
장애 시나리오·대응 — 5종 장애 · 5단계 절차 · RCA 5기법
모든 시스템은 결국 망가진다. 얼마나 빨리 회복하고 배우는가가 TA의 진짜 실력.
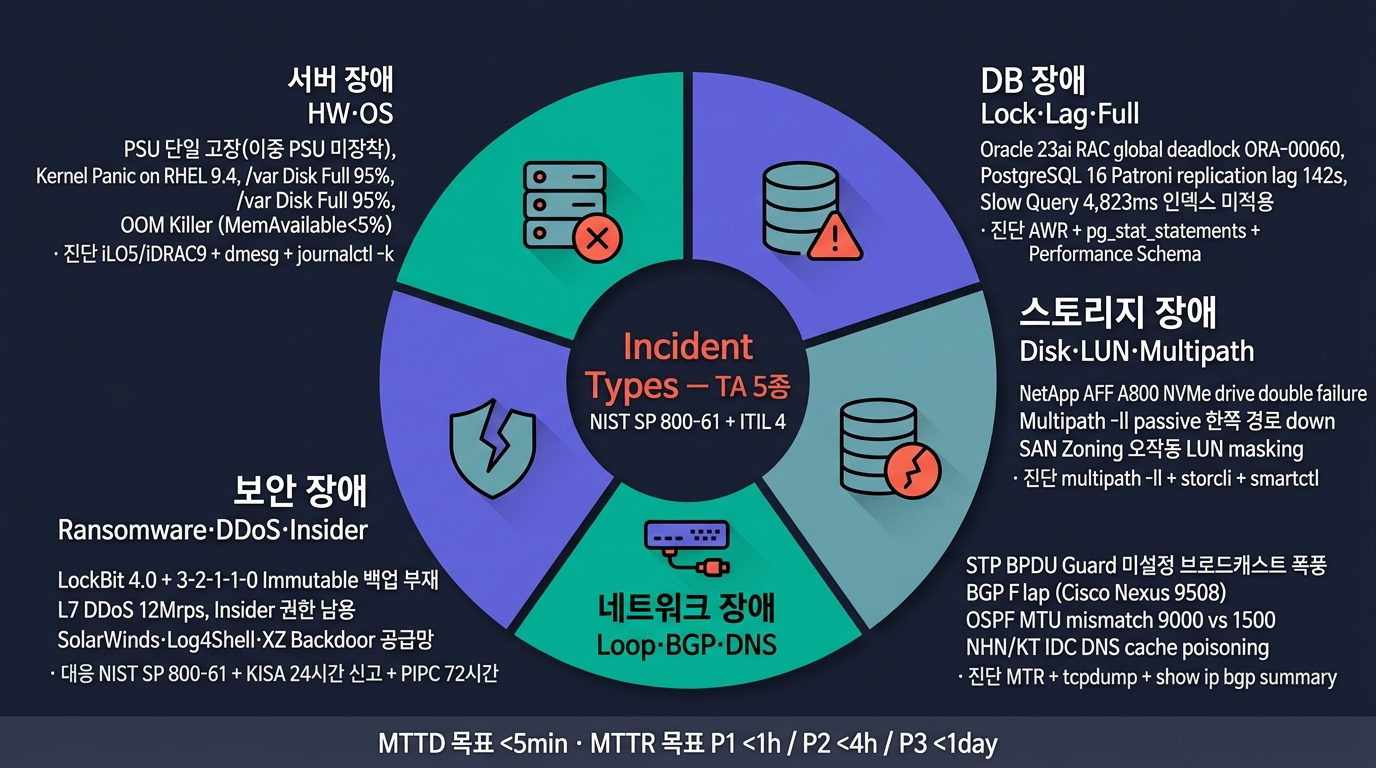
장애 5종 wheel (삽화)
서버 장애 — HW · OS · 메모리 · 디스크
🔥 HW 장애
- PSU (Power Supply) — 전원 끊김, 이중 PSU 필수
- Fan 고장 — 발열 → 자동 정지
- 메모리 ECC 정정 — 경고 → 교체 예고
- 메모리 Uncorrectable — 즉시 정지
- CPU 손상 — 매우 드뭄
- 디스크 SMART 경고 — 사전 교체 (예방 정비)
- NIC/HBA 고장 — Bonding/Multipath로 회피
🛡️ OS 장애
- Kernel Panic (Linux) — 커널 충돌, 자동 재부팅
- BSOD (Windows) — Blue Screen
- 메모리 누수 — OOM Killer 발동
- 디스크 풀 (/var·/tmp) — 로그 폭증
- Zombie/Defunct 프로세스 폭증
🔍 진단 시퀀스
- iLO/iDRAC 콘솔 접근 — HW 상태 확인
- SEL (System Event Log) — HW 이벤트
- dmesg / journalctl -k — 커널 메시지
- /var/log/messages·syslog — 시스템 로그
- top·iostat·vmstat — 자원 상태
- df -h·du — 디스크 사용량
- SMART (smartctl) — 디스크 건강
📋 사전 예방
- iLO/iDRAC 알람 → NMS·SIEM 연동
- 디스크 SMART 임계 자동 발주
- 메모리 ECC 카운터 임계 알람
- 디스크 사용률 80% 알람
- 세션 누수 모니터링
DB 장애 — Lock · Slow Query · Replication Lag
🚨 흔한 DB 장애
- 테이블 락 (Deadlock·Lock Wait) — 트랜잭션 충돌
- Slow Query — 인덱스 누락·통계 오래됨
- Replication Lag — Standby 뒤처짐
- Standby 깨짐 — 복제 끊김
- TEMP·UNDO 풀 — 대용량 정렬·트랜잭션
- Connection Pool 고갈 — 연결 누수·과다 요청
- Disk Full — 로그·아카이브 미회수
- Statistics Stale — 옵티마이저 오판
- Index Bloat — 재구성 필요
🛠️ 진단 도구
- AWR / Statspack (Oracle)
- pg_stat_statements (PostgreSQL)
- Performance Schema (MySQL)
- DMV (MSSQL)
🚑 대응 절차
- 활성 세션 —
v$session·pg_stat_activity·sp_who2 - Lock 분석 — Holder vs Waiter
- Slow Query — TOP-N 쿼리·실행 계획
- Replication Status — Lag·last_replay_time
- Resource — CPU·IO·메모리
- 즉시 조치 — Lock Holder Kill·Standby 재구성
- 사후 — 인덱스 추가·통계 갱신·튜닝
📋 예방
- Slow Query 알람 — > 3초 알람
- Lock Wait 임계 — 30초 알람
- Replication Lag 임계 — 60초 알람
- Connection Pool 사용률 80% 알람
🎨 이미지 프롬프트: "Editorial terminal screenshot illustration on dark navy background — single wide dark terminal window (zsh on RHEL 9.4 jumpbox, prompt
[park@bastion ~]$) titled 'kubectl logs -f deploy/payment-svc -n prod --tail=200 (Kubernetes v1.31, cluster=prod-seoul-rke2)' showing color-coded streaming log output: timestamps, INFO (green), WARN (yellow), ERROR (red) levels, log messages like '2026-05-30T03:42:11.182Z ERROR [HikariPool-1] could not acquire connection from pool (timeout 5000ms, active=50/50, idle=0, pending=18) — exhausted', '2026-05-30T03:42:12.041Z WARN [orderRepo] slow query detected: 4823ms SELECT o.* FROM orders o JOIN payments p ON p.order_id=o.id WHERE o.created_at > $1 — missing index on (created_at, status)', '2026-05-30T03:42:13.118Z ERROR [tx-mgr] org.springframework.transaction.CannotCreateTransactionException', '2026-05-30T03:42:14.012Z INFO [actuator] health check ok (db=UP redis=UP rabbit=UP)'; below it a second terminal titled 'kubectl describe pod payment-svc-7d8c4f9-xz9k2 -n prod' showing 'Status: Running (Last Probe Failed)', Conditions table 'Initialized=True ContainersReady=False PodScheduled=True', container restart count 3, 'Last State: Terminated · Reason: OOMKilled · Exit Code: 137 · Started: ... · Finished: 03:40:17Z', Events list 'Warning Unhealthy 2m kubelet Liveness probe failed: HTTP 503 / Warning BackOff 1m kubelet Back-off restarting failed container / Normal Pulled 30s kubelet Container image registry.lg-cns.com/payment-svc:v2.14.7 pulled'; bottom-right small third terminalkubectl get pods -A --field-selector=status.phase!=Runningshowing 4 non-Running pods (1 CrashLoopBackOff red, 2 Pending yellow, 1 Evicted); clean editorial terminal style with monospace JetBrains Mono font feel, teal #00b894 accents, 16:9"
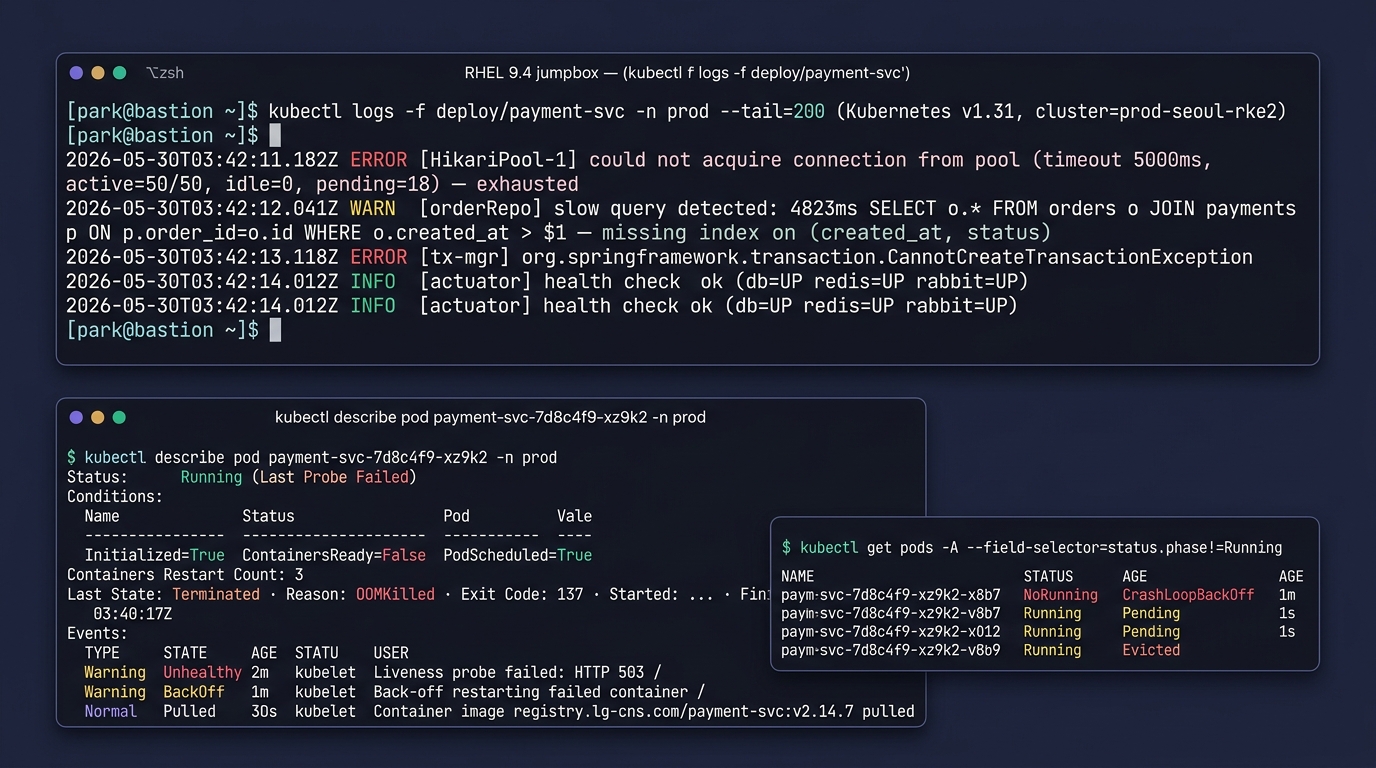
DB 장애 — Lock · Slow Query · Replication Lag
스토리지 장애 — Disk · LUN · Multipath · Snapshot
💾 흔한 스토리지 장애
- 디스크 단일 고장 — RAID로 회피, 재구성
- 다중 디스크 고장 — RAID 6도 위험
- LUN Masking 오류 — 호스트 접근 차단
- WWN 변경 미반영 — HBA 교체 후
- Multipath 실패 — 한쪽 경로만 사용 → 성능↓
- Zoning 오류 — SAN 패브릭 격리
- Snapshot Full — Snapshot 영역 포화
- Replication 끊김 — Primary-Secondary
- Controller Failover — 짧은 IO 지연
🛠️ 진단 도구
- multipath -ll (Linux)
- storcli·megacli (RAID 컨트롤러)
- smartctl (디스크 SMART)
- vendor CLI — NetApp
sysstat·Dellsolutions enabler
🚑 대응 절차
- 알람 확인 — NMS·벤더 콘솔
- 경로 점검 — Multipath 양쪽 활성
- RAID 상태 — Degraded·Rebuilding
- Snapshot 영역 — 용량·자동 회수
- 벤더 콜 — H/W 교체 (Hot Spare)
- 재구성 모니터링 — Rebuild 시간 (시간~일)
- 사후 — Hot Spare 재배치·정기 점검
📋 예방
- 다중 RAID 1+0·6 + Hot Spare 설계
- Multipath 양쪽 정상 알람
- Snapshot 영역 80% 알람
- Replication Lag 알람
- 벤더 자동 콜홈 (Phone Home)
네트워크 장애 — Loop · BGP · MTU · ARP · DNS
🌐 흔한 NW 장애
- 케이블 단선 — 물리적·뽑힘
- STP Loop — 미설정 포트 → 브로드캐스트 폭풍
- BGP Flap — Peer 다운·정책 오류
- OSPF Adjacency — 인증·MTU 불일치
- MTU Mismatch — Jumbo Frame 부분 적용
- ARP Storm — Proxy ARP·Gratuitous ARP
- DNS 장애 — 외부 DNS·Cache 오염
- NTP 어긋남 — 인증서·로그 시간 오류
- DDoS — 외부 폭주
- VLAN 누락 — Trunk 미허용
- Asymmetric Routing — 응답 경로 불일치
🚑 진단 시퀀스
- 인터페이스 상태 —
show interface·ethtool - CDP/LLDP 이웃 — 연결 확인
- STP 상태 — Root·Blocked Port
- MAC 학습 —
show mac addres6-table - ARP 캐시 —
arp -an - 라우팅 테이블 —
show ip route - MTU·DF bit —
ping -M do -s 8972 - DNS·NTP —
dig·chronyc·ntpq - 패킷 캡처 —
tcpdump·SPAN
📋 예방
- BPDU Guard·Root Guard·Loop Guard
- 포트 모니터링·LLDP 의무화
- DNS 이중화 (Primary + Secondary)
- NTP Stratum 1 + Stratum 2 이중화
보안 장애 — Ransomware · DDoS · Insider · Supply Chain
🔐 흔한 보안 장애
- 랜섬웨어 — 파일 암호화·금전 요구
- DDoS — 외부 트래픽 폭주
- 내부자 유출 — 권한 남용·실수
- 계정 탈취 — 피싱·비밀번호 재사용
- 공급망 공격 — 3rd party SW 침해 (SolarWinds·Log4Shell·XZ Backdoor)
- APT — 장기간 잠복·표적
- 악성 코드 — 트로이·웜·키로거
- 웹쉘 업로드 — 파일 업로드 취약점
- SQL Injection — DB 직접 접근
🛠️ 탐지 도구
- EDR / XDR
- SIEM 룰·이상행위
- WAF / Anti-DDoS
- NDR (Network Detection & Response)
🚑 인프라 운영 관점 — 감지·격리 2축
- 감지 — SIEM·EDR·이상 트래픽·NDR 룰 → 자동 알람을 NOC/SOC 통합 채널로
- 격리 — 망 차단(VLAN/ACL)·계정 잠금(IAM)·VM 스냅샷·세션 강제 종료
📚 NIST SP 800-61 6단계 (Preparation·Detection·Containment·Eradication·Recovery·Lessons Learned) 본문은 Session 7
## 침해사고 대응참조 — KISA 72시간 신고 등 한국 절차 포함.
📋 사전 예방
- Immutable 백업 (3-2-1-1-0)
- MFA 의무화
- 권한 최소화 (PoLP)
- 공급망 SBOM 관리
- 모의 침투·취약점 진단 정기
장애 대응 5단계 — Detect · Contain · Investigate · Recover · Postmortem
탐지 → 격리 → 조사 → 복구 → 회고의 사이클. 회고에서 도출된 개선이 다음 사이클의 탐지 역량으로 환류된다.
장애 대응 — 단계별 행동 가이드
① Detection (탐지)
- 알람·로그·고객 신고
- 영향 범위 1차 확인
- 등급 판정 (P1·P2·P3)
② Containment (격리)
- 영향 확산 차단
- 트래픽 차단·계정 정지
- 백업·증거 보존
③ Investigation (조사)
- 원인 분석·재현
- 로그·트레이스·메트릭 협업
- 5 Why·Fishbone
④ Recovery (복구)
- 정상 상태 복귀
- 데이터 정합성 확인
- 모니터링 강화
⑤ Postmortem (회고)
- Blameless — 사람 비난 금지, 구조 개선
- 타임라인·원인·교훈
- Action Item 추적
- 개선 사항 → 다음 Detection 강화
🎯 KPI
- MTTD (Mean Time To Detect) — 탐지까지
- MTTR (Mean Time To Recover) — 복구까지
- MTBF — 장애 간 평균
- MTBI — 사고 간 평균
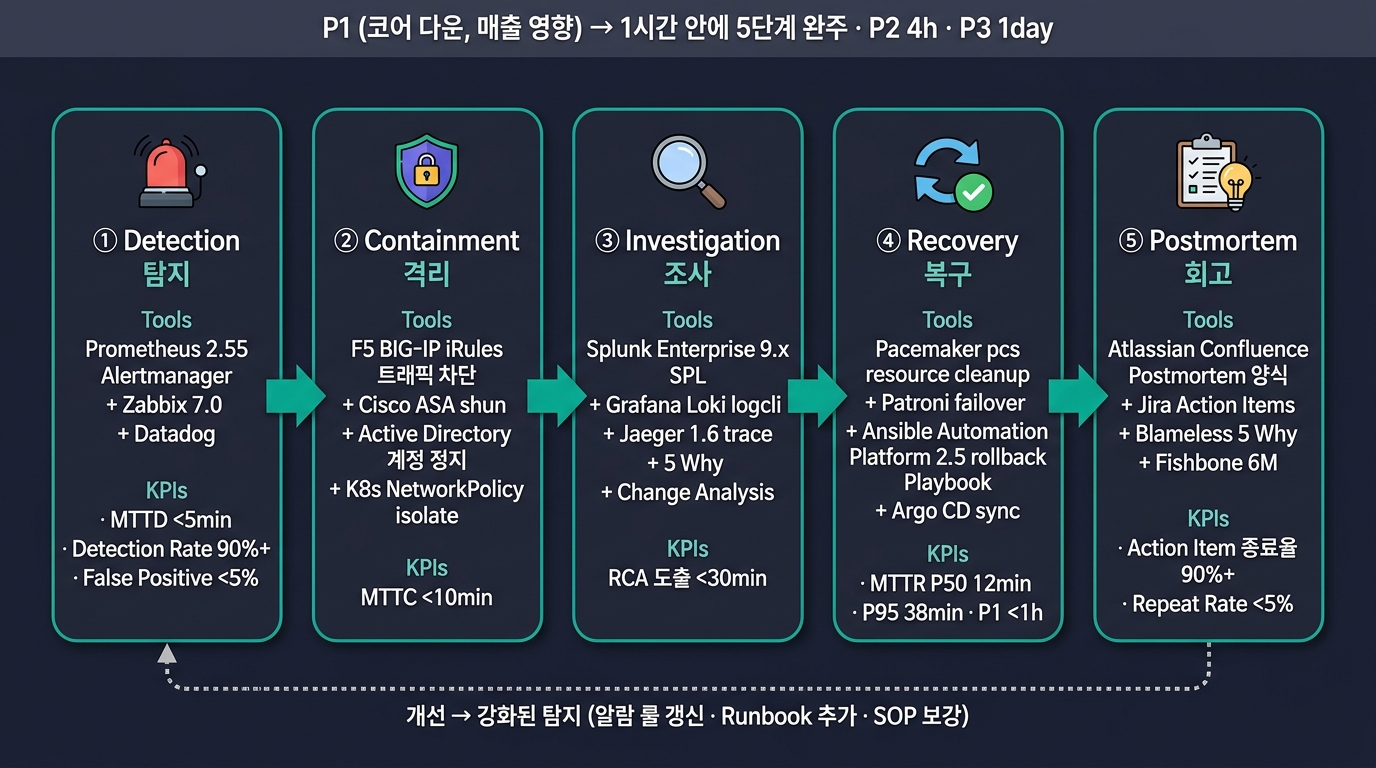
장애 대응 5단계 흐름 (삽화)
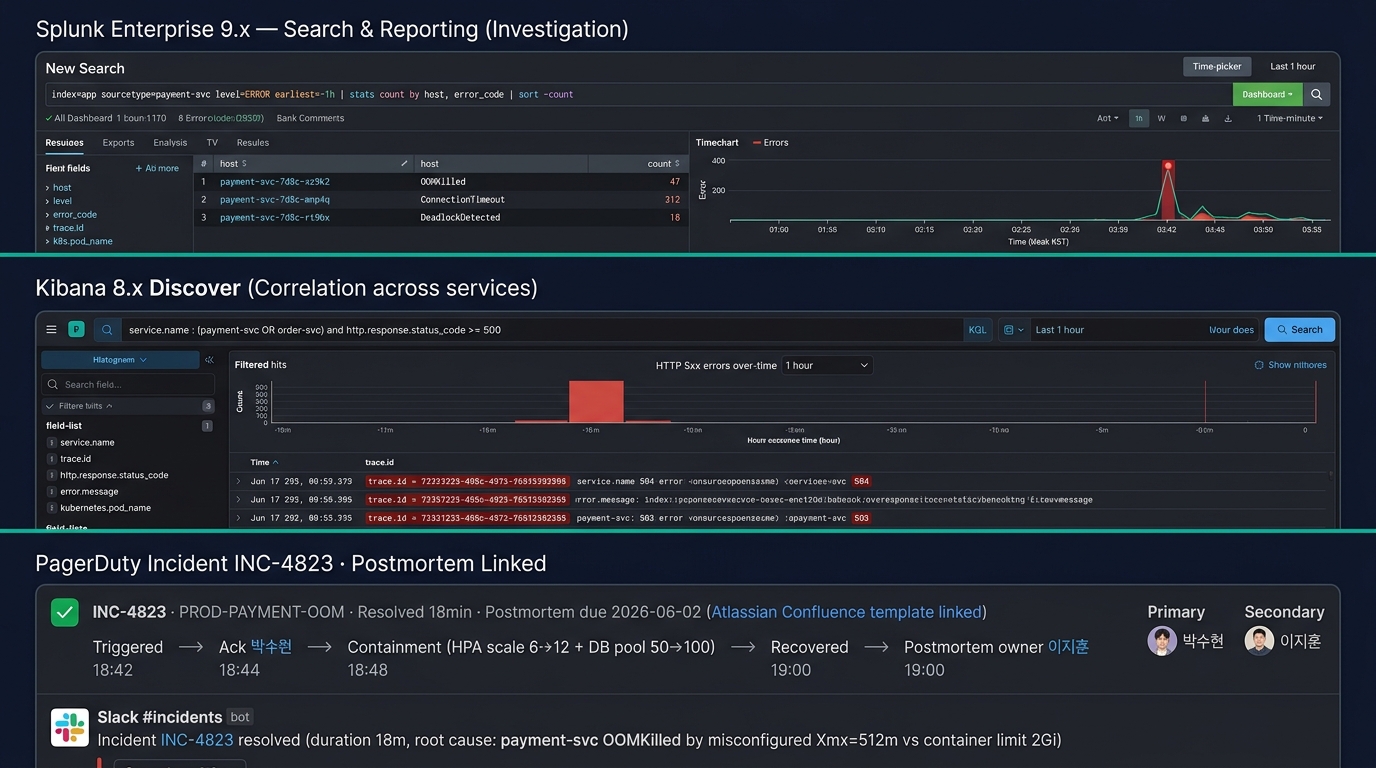
장애 대응 콘솔 사이클 (삽화)
RCA — Root Cause Analysis 5기법
🤔 5 Why
- 왜?를 5번 반복하여 근본 원인 도달
- 가장 단순·강력
- 예: "사이트 다운 → DB 다운 → 디스크 풀 → 로그 미회수 → 회수 스크립트 미작동 → cron 권한 변경"
- 마지막 Why가 구조적 원인 = 진짜 RCA
🐟 Fishbone (특성요인도·이시카와)
- 6M (Man·Machine·Material·Method·Measurement·Environment)
- 또는 4P (Policy·Process·People·Plant)
- 시각적 가지치기
- 협업·브레인스토밍에 적합
🌳 Fault Tree Analysis (FTA)
- Top Event (장애) → 하위 원인 트리
- AND·OR 게이트로 논리 결합
- 항공·원자력·의료 표준
- 확률 계산까지 가능
📊 Pareto Analysis
- 80/20 법칙 — 20% 원인이 80% 장애
- TOP-N 빈도 분석
- 우선순위 결정
🔄 Change Analysis
- 변경 전후 비교 — "무엇이 바뀌었나?"
- 80% 이상 장애는 변경 직후 발생
- 변경관리 (CR·CAB) 기록 필수
격언: "장애 원인의 80%는 직전 변경" — Change Analysis가 가장 빠른 RCA.
장애 KPI — MTTR · MTBF · Detection Rate
📊 핵심 KPI
- MTTD (Mean Time To Detect) — 발생 → 탐지
- 목표: < 5분 (자동 알람)
- MTTA (Mean Time To Acknowledge) — 탐지 → 인지
- 목표: < 5분 (on-call)
- MTTR (Mean Time To Recover) — 탐지 → 복구
- 목표: 등급별 (P1 1시간·P2 4시간·P3 1일)
- MTBF (Mean Time Between Failures) — 장애 간격
- MTBI (Mean Time Between Incidents) — 사고 간격
📈 부가 KPI
- Detection Rate — 자동 탐지 비율 (목표 90%+)
- False Positive Rate — 오탐 비율 (목표 < 5%)
- Auto-Remediation Rate — 자동 복구 비율
- Repeat Rate — 동일 원인 재발률
- SLO 위반 빈도
🎯 산업 표준 목표
- 공공·금융 코어 — MTTR < 1시간
- 일반 업무 — MTTR < 4시간
- 저관심 시스템 — MTTR < 1일
PART G
IaC · SRE · 자동화 — 반복 가능한 운영
한 번 손으로 한 작업은 두 번부터 자동화한다 — Toil은 SRE의 적.
IaC — Infrastructure as Code · 왜 필요한가
💡 IaC가 해결하는 문제
- 수동 설정 → 환경 차이 (Snowflake)
- 재현 불가 → 장애 시 복구 어려움
- 기록 없음 → 변경 추적 불가
- 인력 의존 → 속인화·휴가 시 정지
- 확장 한계 → 노드 추가 시 시간 소요
🎯 IaC 핵심 원칙
- 선언적 (Declarative) — "어떤 상태인지" 선언
- 버전 관리 (Git) — 변경 추적·롤백
- 멱등성 (Idempotent) — 여러 번 실행해도 같은 결과
- 자동화 (CI/CD) — 사람 개입 최소
📊 도구 분류
- 구성 관리 — 기존 서버 설정 (Ansible·Puppet·Chef·SaltStack)
- 프로비저닝 — 신규 자원 생성 (Terraform·Pulumi·CloudFormation)
- 컨테이너 오케스트레이션 — K8s·Helm·Kustomize
- GitOps — Argo CD·Flux
⚠️ IaC 함정
- State 파일 충돌 — Terraform state lock 필수
- Secrets 관리 — Git에 평문 금지 (Vault·SOPS)
- Drift — 손으로 변경 → IaC와 불일치
- 테스트 부족 — IaC도 코드, 테스트 필요
구성 관리 — Ansible · Puppet · Chef · SaltStack 비교
🛠️ 4대 도구 비교
| 도구 | 언어 | Agent | 학습 |
|---|---|---|---|
| Ansible | YAML | Agentless (SSH) | 쉬움 |
| Puppet | DSL | Agent | 중간 |
| Chef | Ruby DSL | Agent | 어려움 |
| SaltStack | YAML | Agent (ZeroMQ) | 중간 |
🎯 한국 SI 표준
- Ansible — 압도적 1위 (Agentless 편의)
- Puppet — 글로벌 엔터프라이즈 잔존
- Chef — 게임·웹 일부
- SaltStack — 대규모 분산 일부
⚠️ 도구 선택 기준
- 1000+ 노드 → Pull 모델 (Puppet·Salt) 유리
- 비동기 작업 → 별도 Job 큐 필요
- 신규 도입 → Ansible 우선
🏆 Ansible (Red Hat) — 깊이 + 사용 사례
🏆 Ansible 핵심 개념
- Agentless — SSH만 있으면 동작
- Playbook — YAML 선언적 정의
- Inventory — 호스트 그룹 관리
- Module 풍부 (3,000+)
- Roles — 재사용 표준화
- Ansible Vault — 비밀 암호화
- AWX / Tower / AAP — Red Hat Web UI
📋 한국 SI 운영 사용 사례
- OS 표준화 — 초기 설정·정기 패치
- App 배포 — 멀티 노드 동시 배포
- DB 스키마 변경 — 정형 작업 자동화
- NW 장비 설정 — Cisco·Juniper 모듈
- 컴플라이언스 체크 — CIS Benchmark
- 장애 대응 Runbook — Playbook으로 코드화
🎨 이미지 프롬프트: "Editorial terminal screenshot illustration on dark navy background — a single wide terminal window with title 'ansible-playbook site.yml -i inventories/prod --check --diff (Ansible Automation Platform 2.5 / ansible-core 2.17)' showing typical color-coded output: green 'PLAY [webservers] ***', yellow 'TASK [common : install nginx 1.26 LTS]', cyan 'ok: [web-01.prod.lg-cns.com]', 'ok: [web-02.prod.lg-cns.com]', yellow 'changed: [web-03.prod.lg-cns.com]', then 'PLAY RECAP' formatted in columns with three host lines
web-01 : ok=12 changed=2 unreachable=0 failed=0 skipped=1 rescued=0 ignored=0,web-02 : ok=12 changed=2 unreachable=0 failed=0 skipped=1,web-03 : ok=11 changed=3 unreachable=0 failed=0 skipped=1, footer hints 'Vault: ansible-vault edit group_vars/prod/secrets.yml'; below it a second terminalkubectl get pods -n prod -o wide (Kubernetes v1.31, rke2)with tabular columns NAME / READY / STATUS / RESTARTS / AGE / IP / NODE, rows 'payment-svc-7d8c-xz9k2 1/1 Running 0 4h12m 10.42.1.18 worker-03', 'payment-svc-7d8c-mnp4q 0/1 CrashLoopBackOff 7 12m 10.42.2.41 worker-05 (red)', 'order-svc-9bf6-qq2t8 2/2 Running 0 2d 10.42.3.7 worker-08', plus another terminalkubectl get nodesshowing 5 control-plane + 12 worker nodes with Ready status; third small terminalhelm upgrade --install lms-app ./chart -f values-prod.yaml --namespace prod --atomic --timeout 5m (Helm 3.15)showing Release info 'NAME: lms-app · LAST DEPLOYED: 2026-05-30 · NAMESPACE: prod · STATUS: deployed · REVISION: 14 · TEST SUITE: None'; bottom stripdocker ps --format \"table {{.ID}}\\t{{.Image}}\\t{{.Status}}\\t{{.Names}}\" (Docker 27.x)showing CONTAINER ID, IMAGE (registry.lg-cns.com/payment-svc:v2.14.7, postgres:16.4, redis:7.4-alpine), STATUS (Up 4 hours, Restarting 32s ago), Names; clean editorial terminal style, teal #00b894 accents, 16:9"
🎨 이미지 프롬프트: "Editorial dark-theme console mockup illustration on dark navy background — Red Hat Ansible Automation Platform 2.5 (formerly Ansible Tower) Job Output view: top header 'Job #4823 · Template: prod-os-patch-monthly · site.yml · Running · Started 02:00 KST · Elapsed 04:12 · Triggered by Schedule (CRON: 0 2 1 * *)', left sidebar with navigation items 'Templates · Job Templates · Workflow Templates · Projects (Git: gitlab.lg-cns.com/infra/playbooks main@a3f912b) · Inventories (prod_inventory 187 hosts) · Hosts · Credentials (HashiCorp Vault 1.16 lookup) · Schedules · Notifications (Slack #ops + PagerDuty)', main pane shows real-time Playbook execution output with green/yellow/red task status lines: 'PLAY [webservers] · TASK [common : update yum cache] ok: [web-01] ok: [web-02] · TASK [common : install kernel-5.14.0-427.13.1.el9_4] changed: [web-03] (yellow) · TASK [security : apply CIS Benchmark RHEL 9 Level 1] ok: [web-01] failed: [web-04] (red error msg: sshd_config PermitRootLogin enforce failed)', ok/changed/failed counters '147/12/1' at top right; right pane shows host list with per-host status pills (green ok, yellow changed, red failed) — web-01 ok · web-02 ok · web-03 changed · web-04 failed · db-01 ok · db-02 ok, with a 'Re-launch on failed hosts' button; small live timeline at top with ramp-up of completed tasks per minute; Red Hat logo top-left, user avatar '박수현 (Org: Infra)' top-right; clean editorial UI mockup style, teal #00b894 accents, 16:9"
📸 Ansible·kubectl·Helm·docker CLI / 콘솔 reference
- Ansible 공식 문서 — docs.ansible.com
- Red Hat Ansible Automation Platform (구 Tower) / AWX — ansible.com/products/automation-platform
- kubectl Cheat Sheet — kubernetes.io/docs/reference/kubectl/cheatsheet (kubectl get pods · kubectl describe pod · kubectl logs -f)
- Helm — helm.sh (helm install · helm upgrade · helm list)
- Docker / Docker Compose — docs.docker.com (docker ps · docker-compose up)
- Rundeck Runbook UI — rundeck.com
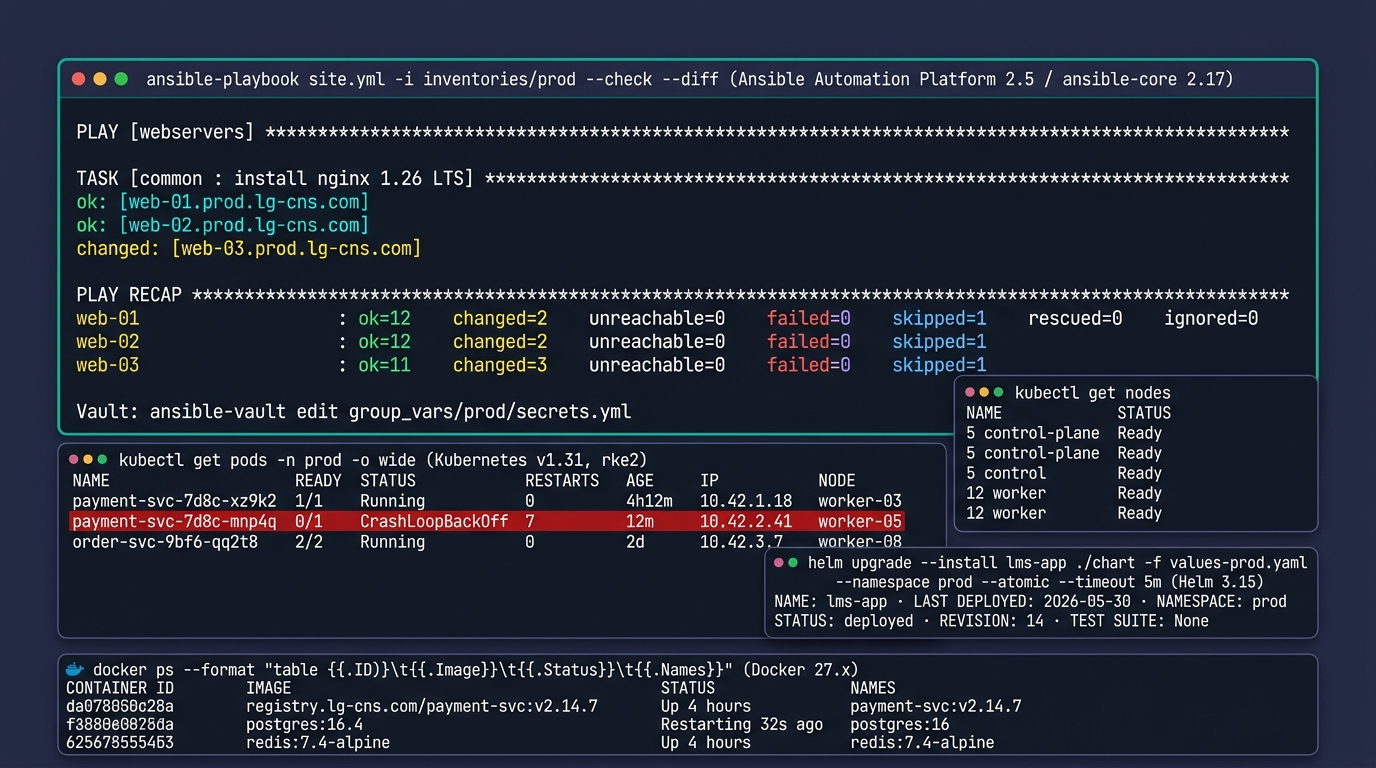
구성 관리 — Ansible · Puppet · Chef · SaltStack
프로비저닝 — Terraform · Pulumi · CloudFormation
🌍 Terraform (HashiCorp → IBM)
- HCL (HashiCorp Configuration Language)
- Multi-Cloud — AWS·Azure·GCP·NCP·VMware
- State 파일 — 원격 백엔드 (S3·GCS·Consul)
- Module — 재사용
- 2023 라이센스 변경 (BSL) → OpenTofu 포크
🐍 Pulumi
- 실제 프로그래밍 언어 (Python·TS·Go·.NET)
- 로직·조건문 자유로움
- 학습 곡선 가파름
☁️ 클라우드 네이티브
- AWS CloudFormation — JSON/YAML
- AWS CDK — 코드 기반 (TS·Python)
- Azure ARM / Bicep — JSON DSL
- GCP Deployment Manager
🔀 Crossplane (CNCF)
- K8s 네이티브 IaC
- CRD로 클라우드 자원 관리
- K8s + Multi-Cloud 통합
🆕 OpenTofu (Linux Foundation)
- Terraform 1.5 포크
- MPL 라이센스 유지
- 2024+ 채택 증가
🎯 한국 환경
- 공공·하이브리드 — Terraform + Ansible 조합
- 단일 클라우드 — 네이티브 도구 (CloudFormation·Bicep)
- K8s 중심 — Crossplane·Argo CD
📋 사용 패턴
- Terraform → VM·NW·스토리지 프로비저닝
- Ansible → OS 설정·App 배포
- Argo CD → K8s 매니페스트 GitOps
🎨 이미지 프롬프트: "Editorial split mockup illustration on dark navy background — left half labeled 'HashiCorp Terraform 1.10 / OpenTofu 1.8 — terraform plan -out=tfplan' showing a terminal with workspace context 'workspace = prod · backend: s3 (s3://lg-cns-tfstate/prod/lms.tfstate · DynamoDB lock) · provider aws ~> 5.70' and color-coded diff output: green '+ aws_instance.web[0] (t3.xlarge, ami-0c9c942bd7bf113a2)', '+ aws_instance.web[1]', yellow '~ aws_lb.web (1 to change: idle_timeout 60 → 120)', red '- aws_security_group.legacy_ssh (will be destroyed)', followed by 'Plan: 2 to add, 1 to change, 1 to destroy. Saved the plan to: tfplan', then on a second line
terraform apply -auto-approve tfplanshowing rolling apply output 'aws_instance.web[0]: Creating... · aws_instance.web[0]: Still creating... [10s elapsed] · aws_instance.web[0]: Creation complete after 42s [id=i-0a1b2c3d]' and final 'Apply complete! Resources: 2 added, 1 changed, 1 destroyed.', tiny bottom strip CLI 'vault kv get -mount=kv prod/aws/access_key' (HashiCorp Vault 1.16 secret lookup); right half labeled 'Argo CD 2.13 Application Tree (GitOps)' showing the signature Argo CD topology DAG (Git repogitlab.lg-cns.com/infra/argocd-apps @ main→ Applicationprod-lms→ Namespaceprod→ Deploymentlms-web→ ReplicaSetlms-web-7d8c4f→ 6 Pods green) with sync-status icons (green check on synced, yellow circular arrow on out-of-synclms-batch), top header 'prod-lms · Synced · Healthy · Last sync 2026-05-30 02:14 KST · Auto-sync ✓ · Self-heal ✓ · Prune ✓ · Revision: a3f912b', sidebar with Applications list (prod-lms ✓, prod-payment ✓, prod-batch ⚠ degraded, dev-lms ✓), Argo CD octopus logo top-left, footer 'Crossplane v1.18 + Argo CD = K8s native IaC pipeline'; clean editorial UI mockup style, teal #00b894 and purple #6c5ce7 accents, 16:9"
📸 IaC·GitOps 콘솔 reference
- Terraform / OpenTofu CLI — developer.hashicorp.com/terraform/cli · opentofu.org (terraform plan · terraform apply -auto-approve)
- HashiCorp Terraform Cloud UI — app.terraform.io
- Argo CD UI — argo-cd.readthedocs.io
- Flux CD — fluxcd.io
- Spinnaker — spinnaker.io
- HashiCorp Vault UI (시크릿 관리 참조) — vaultproject.io
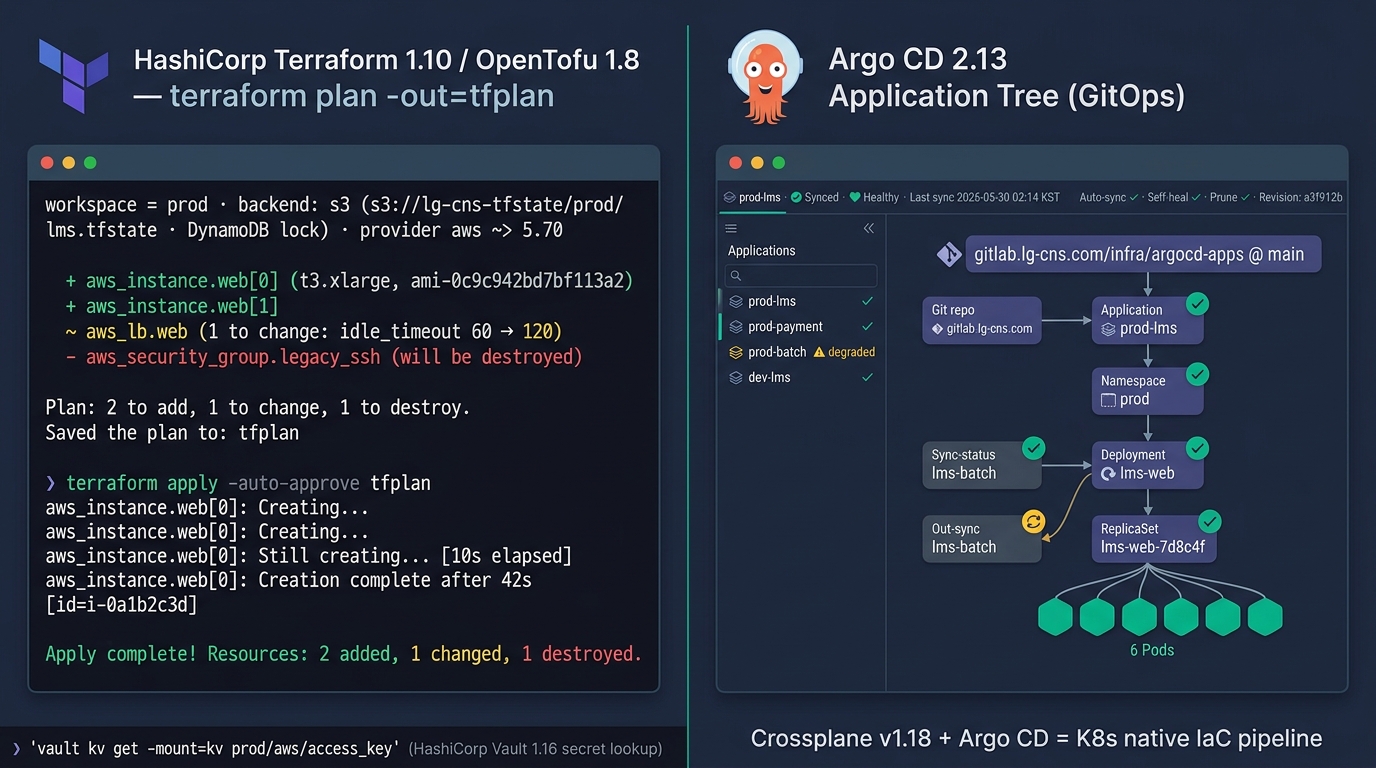
프로비저닝 — Terraform · Pulumi · CloudFormation
CI/CD — Jenkins · GitLab · GitHub Actions · Argo CD
🔄 CI (Continuous Integration)
- Jenkins — 가장 흔한 표준, 플러그인 풍부, 복잡
- GitLab CI — GitLab 통합, YAML
- GitHub Actions — GitHub 통합, Marketplace 풍부
- Tekton (CNCF) — K8s 네이티브
- Drone CI — 컨테이너 네이티브
- CircleCI · Travis CI — SaaS
🚀 CD (Continuous Deployment)
- Argo CD — K8s GitOps 표준
- Flux — K8s GitOps (CNCF)
- Spinnaker — 멀티 클라우드 (Netflix·Google)
- Harness — 상용 SaaS
- AWS CodeDeploy / Azure DevOps
🎯 배포 전략
- Recreate — 전체 중지 후 새 버전 (간단·다운타임)
- Rolling Update — 점진 교체 (K8s 기본)
- Blue/Green — 동시 운영 → 스위치
- Canary — 일부 트래픽 → 점진 확대
- Feature Flag — 기능 토글 (LaunchDarkly·Unleash)
- A/B Testing — 사용자 그룹 분리
🎙️ TA의 관심사
- 무중단 배포 — Rolling·Blue/Green
- 롤백 시간 — < 5분 목표
- 승인 단계 — 운영 환경 수동 승인 (한국 SI)
- 변경관리 (CAB) 연동
SRE — Site Reliability Engineering 원칙
🎯 SRE 핵심 원칙 (Google SRE Book)
- 신뢰성은 가장 중요한 기능
- SLO 기반 운영 (SLA가 아닌 SLO)
- Error Budget — SLO 여유 = 새 기능 개발 가능
- Toil 자동화 — 반복 수작업 50% 이하
- Blameless Postmortem
- 점진적 변경 + 빠른 롤백
- 공유 책임 — 개발 + 운영 공동
- 자동 복구 + Human-in-the-loop
🔢 SLI · SLO · SLA
- SLI (Indicator) — 측정값 (응답시간·에러율·가용성)
- SLO (Objective) — 내부 목표 (99.9%)
- SLA (Agreement) — 외부 계약 (99.5%로 더 낮게)
💰 Error Budget
- Error Budget = 1 - SLO
- SLO 99.9% → Budget = 0.1% = 월 43분
- Budget 남음 → 새 기능 배포 OK
- Budget 소진 → 새 기능 중단, 신뢰성 작업만
- 개발팀과 운영팀의 공통 언어
😫 Toil (반복 수작업)
- 수동·반복·자동화 가능·진행성 없는 작업
- 목표: 50% 이하 (나머지는 개발·개선)
- 예: 수동 배포·수동 알람 처리·수동 사용자 추가
- 자동화 → 코드·도구로 흡수
SRE vs DevOps vs 운영팀 — 어떻게 다른가
👷 전통 운영팀 (Ops)
- 개발 ↔ 운영 분리
- 수동 배포·수동 패치
- 알람 받고 대응 (Reactive)
- 변경관리·CAB 중심
- 안정성 중시·변화 회피
- KPI: 다운타임·MTTR
- 흔한 한국 SI 형태
🔄 DevOps (문화·실천)
- 개발 + 운영 통합 문화
- CI/CD·IaC·자동화
- "You build it, you run it"
- 협업·도구 중심
- 빠른 배포·실험
- KPI: Deployment Frequency·Lead Time
- 도구가 많이 보이는 형태
🛡️ SRE (직무·역할)
- 신뢰성을 코드로 보장
- SLO·Error Budget 운영
- Toil 자동화
- 사고 후 Blameless 회고
- 개발자급 코딩 스킬
- KPI: SLO·Error Budget·Toil%
- Google·대규모 SaaS 출신
관계: DevOps는 문화, SRE는 그 문화를 구현하는 직무, 운영팀은 전통 모델. SRE = 코드로 운영을 자동화하는 DevOps의 한 형태.
운영 자동화 사례 — Toil 제거 5가지
🤖 자동화 적용 영역
- 사용자 계정 관리 — Self-Service Portal + LDAP
- 인증서 갱신 — Cert-Manager·Let's Encrypt
- 백업 검증 — 자동 복구 테스트
- OS 패치 — 정기 Ansible Playbook
- 알람 → 자동 조치 — Runbook 자동화
- DB Slow Query 자동 알림 + 인덱스 제안
- 디스크 풀 자동 회수 — 로그 압축·이동
- Failover 자동화 — Pacemaker·Patroni
🛠️ 자동화 도구
- Ansible Tower / AWX — 작업 스케줄링
- Rundeck — Runbook 자동화
- StackStorm — 이벤트 기반 자동화
- n8n / Zapier — 워크플로 자동화
📊 자동화 ROI 계산
- Toil 시간 — 작업당 시간 × 빈도 × 인원
- 자동화 비용 — 개발 시간 + 유지
- ROI — Toil 절감 ÷ 자동화 비용
- 손익분기 < 12개월 → 자동화 OK
🎯 자동화 우선순위
- 고빈도·고리스크 — 즉시 자동화 (계정·인증서)
- 고빈도·저리스크 — 점진 자동화 (백업 검증)
- 저빈도·고리스크 — 절차서 + 훈련 (DR Failover)
- 저빈도·저리스크 — 그대로 (1년 1회 작업)
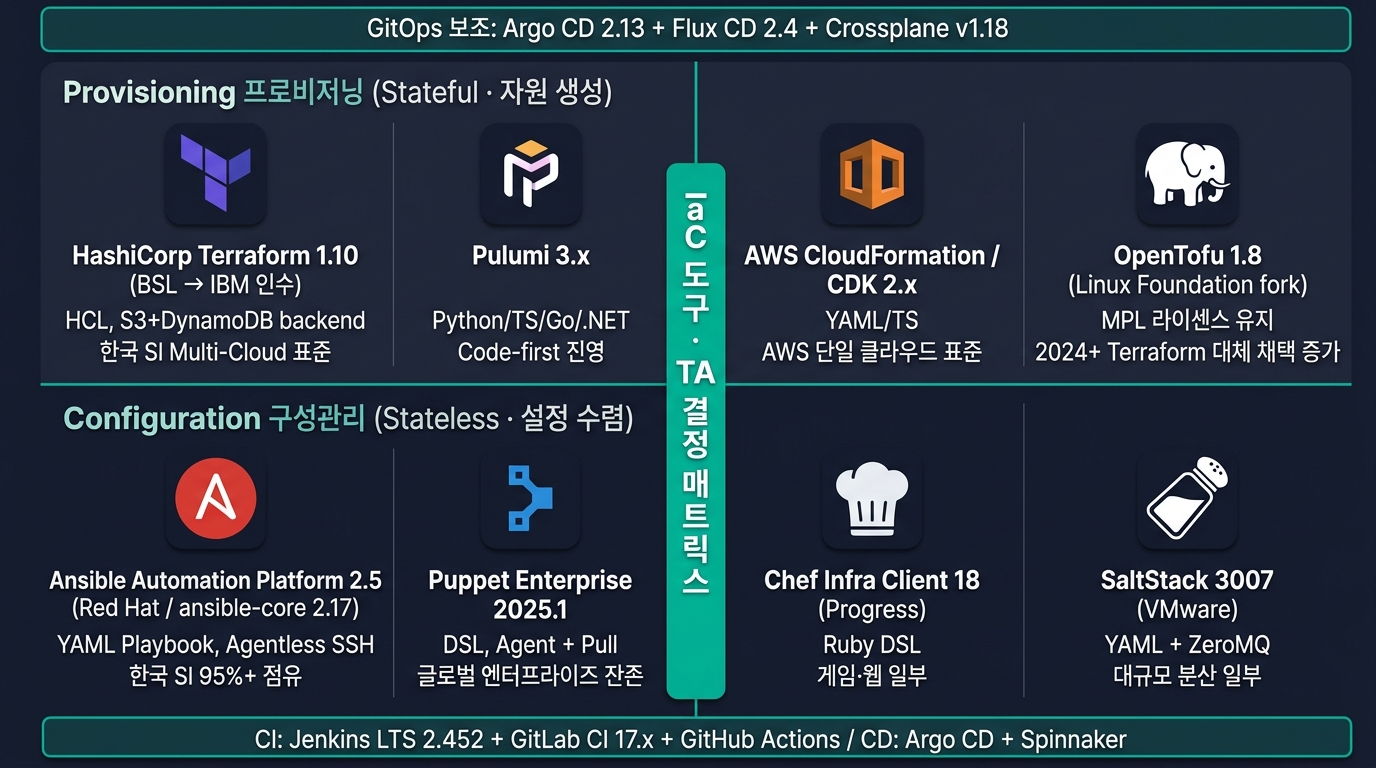
IaC 도구 매트릭스 (삽화)
PART H
산출물·결정·정리 — TA가 결정해야 할 12가지
이 세션이 끝나면 TA는 12개 결정 포인트와 6대 산출물을 정리해 두어야 한다.
TA의 12 결정 — HA · 운영 설계에서
🎯 HA·SLA 결정
- 시스템 등급 — BIA 기반 SLA 매기기
- HA 패턴 선택 — N+1·2N·Active-Active
- DR 모드 — Cold·Pilot Light·Warm·Hot
- DR 거리 — 동기 가능 여부 (100km)
📐 용량·자원 결정
- TPS 가정값 — 사고시간 표준
- CPU 마진 비율 — 평균·피크·이벤트
- DB 메모리 비율 — 데이터의 30~50%
- 스토리지 유형 — Block·File·Object·Tape
🔬 관찰성·운영 결정
- 관찰성 스택 — Prometheus·Datadog·Splunk
- 알람 정책 — Actionable·SLO 기반
- 장애 대응 등급 — P1~P4·에스컬레이션
- 자동화 우선순위 — Toil ROI 계산
📋 산출물 6종
- HA 매트릭스 — 패턴별 비용·가용성
- SLA 정의서 — 가용성·페널티
- 용량 산정서 — 5단계 + 가정값
- 관찰성 설계서 — 3축 + 도구
- 장애 대응 SOP — 5단계·등급·통신
- 자동화 계획서 — Toil 분석·로드맵
산출물 템플릿 — 6대 문서 구조
📊 1. HA 매트릭스
| 시스템 | 등급 | HA 패턴 | DR | SLA |
|---|---|---|---|---|
| 결제 코어 | 1 | 2N+1 | Hot | 99.99% |
| LMS | 2 | Active-Active | Warm | 99.9% |
| 내부 위키 | 4 | 단일 | Backup | 99% |
📊 2. SLA 정의서
- 가용성 목표·측정 방법
- 페널티 단계
- 제외 조항 (점검·재해)
📐 3. 용량 산정서
- 1장. 입력값·가정값
- 2장. 5단계 산출
- 3장. CPU·Mem·IOPS·NW 표
- 4장. 마진 적용
- 5장. 검증 결과
- 6장. BOM·라이센스
🔬 4. 관찰성 설계서
- Metrics 스택·메트릭 목록
- Logs 스택·보관 정책
- Traces 스택·샘플링
- 알람 매트릭스
🚨 5. 장애 대응 SOP
- 등급 정의 (P1~P4)
- 에스컬레이션 매트릭스
- 5단계 절차
- 통신 템플릿
- Postmortem 양식
🤖 6. 자동화 계획서
- Toil 분석 (현황)
- 우선순위 매트릭스
- 도구 선정
- 로드맵 (분기별)
- ROI 계산
부록 — 핵심 용어 정리
HA·SLA
- HA — High Availability
- DR — Disaster Recovery
- SLA — Service Level Agreement
- SLO — Service Level Objective
- SLI — Service Level Indicator
- MTBF — Mean Time Between Failures
- MTTR — Mean Time To Recover
- MTTD — Mean Time To Detect
- RPO — Recovery Point Objective
- RTO — Recovery Time Objective
클러스터링
- RAC — Real Application Cluster
- AG — Always On Availability Group
- VCS — Veritas Cluster Server
용량·성능
- TPS — Transactions Per Second
- IOPS — Input/Output Per Second
- MAU·DAU — Monthly/Daily Active User
- SPECint — Standard Perf Eval Corp int
- TPC-C — TPC Benchmark C
관찰성
- NMS — Network Management System
- APM — Application Performance Monitoring
- SIEM — Security Info & Event Management
- OTel — OpenTelemetry
SRE·IaC
- SRE — Site Reliability Engineering
- IaC — Infrastructure as Code
- CI/CD — Continuous Integration/Delivery
- CAB — Change Advisory Board
- CR — Change Request
장애·RCA
- RCA — Root Cause Analysis
- FTA — Fault Tree Analysis
- NIST SP 800-61 — Incident Handling Guide
도구
- ELK — Elasticsearch·Logstash·Kibana
- EFK — Elasticsearch·Fluentd·Kibana
- PLG — Prometheus·Loki·Grafana
- GitOps — Git 기반 운영
한국 SI 단골
- JEUS·WebtoB·Tibero — TmaxSoft 3종
- Pinpoint·Scouter·Jennifer — APM 3종
- Zabbix·SolarWinds — NMS 표준
부록 — 9의 개수별 다운타임 환산표
| 가용성 | 9 개수 | 연간 | 분기 | 월간 | 주간 | 일일 |
|---|---|---|---|---|---|---|
| 90% | 1 | 36.5일 | 9.13일 | 3.04일 | 16.8시간 | 2.4시간 |
| 95% | 1.5 | 18.25일 | 4.56일 | 1.52일 | 8.4시간 | 1.2시간 |
| 99% | 2 | 3.65일 | 21.9시간 | 7.2시간 | 1.68시간 | 14.4분 |
| 99.5% | 2.5 | 1.83일 | 10.95시간 | 3.6시간 | 50.4분 | 7.2분 |
| 99.9% | 3 | 8.76시간 | 2.19시간 | 43.8분 | 10.1분 | 1.44분 |
| 99.95% | 3.5 | 4.38시간 | 1.10시간 | 21.9분 | 5.04분 | 43.2초 |
| 99.99% | 4 | 52.6분 | 13.15분 | 4.38분 | 1.01분 | 8.64초 |
| 99.995% | 4.5 | 26.3분 | 6.57분 | 2.19분 | 30.2초 | 4.32초 |
| 99.999% | 5 | 5.26분 | 1.31분 | 26.3초 | 6.05초 | 0.86초 |
| 99.9999% | 6 | 31.5초 | 7.88초 | 2.63초 | 0.6초 | 0.09초 |
TA의 기준값 외우기: 99.9% = 월 43분·99.99% = 월 4.38분·99.999% = 월 26초.
부록 — 용량 산정 체크리스트 (20개 항목)
✅ 입력값 확보 (1~10)
- [ ] MAU·DAU·동접 산정 기준
- [ ] 사고시간 가정값 (시스템 유형별)
- [ ] 평균 vs 피크 비율 (시간대별)
- [ ] 이벤트 폭증 계수 (수강신청·할인)
- [ ] 응답시간 SLA (평균·p95·p99)
- [ ] 데이터 현재량·일증가율
- [ ] 보관기간·법규 요구
- [ ] HA 등급·DR 모드
- [ ] 라이센스 모델 (Core·Socket·User)
- [ ] 가상화·컨테이너 오버헤드
✅ 산출·검증 (11~20)
- [ ] TPS 산정 (평균·피크·이벤트)
- [ ] CPU 산정 (트랜잭션 ms × 마진)
- [ ] Memory 산정 (WAS·DB·OS)
- [ ] IOPS 산정 (DB·로그·백업)
- [ ] NW 대역 산정 (응용·세션·백업)
- [ ] 스토리지 용량 (운영·백업·DR)
- [ ] 마진 적용 (피크·성장·HA)
- [ ] 부하 테스트 실측
- [ ] 가정값·산정 근거 문서화
- [ ] 1년차 재산정 일정
부록 — 장애 대응 통신 템플릿
📢 1차 통지 (탐지 5분 이내)
[장애 발생] {시스템명} 일부 영향
- 발생 시각: YYYY-MM-DD HH:MM
- 영향 범위: {서비스명·기능}
- 상태: 조사 중
- 다음 업데이트: 30분 후
- 담당자: {이름·연락처}
📢 2차 통지 (30분 이내)
[장애 업데이트] {시스템명}
- 원인 가설: {1차 가설}
- 임시 조치: {차단·우회}
- 영향: {업무·사용자}
- ETA: 복구 예상 {시각}
- 다음 업데이트: 1시간 후
📢 복구 완료 통지
[장애 복구] {시스템명}
- 복구 시각: YYYY-MM-DD HH:MM
- 다운타임: {합계}
- 원인: {요약}
- 조치: {요약}
- 사후 분석: Postmortem 작성 중
- 보고서: 1주 이내
📢 Postmortem 양식
- 개요·타임라인
- 영향 분석 (사용자·매출)
- 근본 원인 (RCA)
- 무엇이 잘 되었나
- 무엇이 잘못 되었나
- Action Items (담당자·기한)
- 재발 방지 항목
부록 — 관찰성 알람 매트릭스 표준
🚨 인프라 알람 (CPU·Mem·Disk·NW)
| 자원 | 경고 | 위험 | 조치 |
|---|---|---|---|
| CPU 5분 평균 | 70% | 85% | 부하 분산·증설 |
| Memory | 80% | 90% | 누수 조사 |
| Disk Used | 80% | 90% | 회수·증설 |
| Disk IO Wait | 20% | 40% | IO 병목 분석 |
| NW 대역 | 70% | 85% | 트래픽 분석 |
| NW 패킷 손실 | 0.1% | 1% | NW 진단 |
🚨 응용·DB 알람
| 항목 | 경고 | 위험 | 조치 |
|---|---|---|---|
| 응답시간 p95 | 1초 | 3초 | APM 트레이스 |
| 에러율 | 0.5% | 2% | 로그 분석 |
| DB Connection % | 70% | 90% | Pool 조사·증설 |
| Slow Query | 1초 | 3초 | 인덱스·튜닝 |
| Replication Lag | 30초 | 60초 | 복제 점검 |
| GC Pause | 1초 | 3초 | JVM 튜닝 |
부록 — Ansible·Terraform 미니 예제
🛠️ Ansible Playbook 예제
- name: Install Nginx
  hosts: webservers
  become: yes
  tasks:
    - name: Install Nginx package
      apt:
        name: nginx
        state: present
        update_cache: yes
    - name: Start Nginx service
      service:
        name: nginx
        state: started
        enabled: yes
    - name: Deploy config
      template:
        src: nginx.conf.j2
        dest: /etc/nginx/nginx.conf
      notify: Reload Nginx
  handlers:
    - name: Reload Nginx
      service:
        name: nginx
        state: reloaded
🛠️ Terraform 예제 (AWS)
provider "aws" {
  region = "ap-northeast-2"
}

resource "aws_instance" "web" {
  count         = 2
  ami           = "ami-0c9c942bd7bf113a2"
  instance_type = "t3.medium"
  tags = {
    Name = "web-${count.index}"
    Env  = "prod"
  }
}

resource "aws_lb" "web" {
  name               = "web-lb"
  load_balancer_type = "application"
  subnets            = var.subnets
  tags = {
    Env = "prod"
  }
}
부록 — Prometheus 알람 룰 예제
groups:
  - name: infrastructure
    interval: 30s
    rules:
      - alert: HighCPUUsage
        expr: 100 - (avg by(instance) (rate(node_cpu_seconds_total{mode="idle"}[5m])) * 100) > 85
        for: 5m
        labels:
          severity: warning
        annotations:
          summary: "High CPU on {{ $labels.instance }}"
          description: "CPU usage is {{ $value }}% (>85%) for 5min"
      - alert: DiskFull
        expr: 100 - ((node_filesystem_avail_bytes / node_filesystem_size_bytes) * 100) > 90
        for: 10m
        labels:
          severity: critical
        annotations:
          summary: "Disk almost full on {{ $labels.instance }}"
      - alert: ServiceDown
        expr: up == 0
        for: 1m
        labels:
          severity: critical
        annotations:
          summary: "Service {{ $labels.job }} is down"
부록 — SLO 정의서 예제
📋 LMS 강의 시청 서비스 SLO
- 서비스: 강의 동영상 재생
- SLI #1 가용성:
- HTTP 2xx/3xx ÷ 전체 응답
- 측정: Prometheus blackbox_exporter
- SLO: 30일 99.9%
- Error Budget: 월 43분
- SLI #2 응답시간:
- p95 < 2초
- 측정: APM 트레이스
- SLO: 30일 95% 요청 충족
- SLI #3 영상 시작 시간:
- 첫 프레임 < 3초
- SLO: 30일 90%
📊 알람·조치
- Error Budget 50% 소진 → 경고
- Error Budget 75% 소진 → 신기능 배포 중단
- Error Budget 100% 소진 → 신뢰성 작업만
- 연속 5분 5xx > 5% → P1 알람
- 응답시간 p95 > 5초 → P2 알람
🔄 검토 주기
- 월간: Error Budget 잔여 검토
- 분기: SLO 임계값 재조정
- 연간: SLA 재협상
부록 — Blameless Postmortem 양식
# Postmortem: [장애 제목] (YYYY-MM-DD)

## 1. 요약
- 장애 시점: YYYY-MM-DD HH:MM ~ HH:MM (총 X분)
- 영향: {서비스·사용자 수·매출 영향}
- 등급: P1·P2·P3
- 책임자: {이름}

## 2. 타임라인
- HH:MM — 알람 발생
- HH:MM — 1차 대응 시작
- HH:MM — 원인 파악
- HH:MM — 임시 조치
- HH:MM — 영구 복구
- HH:MM — 정상화 확인

## 3. 근본 원인 (RCA)
- 직접 원인: {기술적 원인}
- 기여 요인: {프로세스·모니터링·문화}
- 5 Why 결과

## 4. 잘 된 점
- {탐지 빠름·협업 원활 등}

## 5. 잘못된 점
- {알람 누락·문서 부족 등}

## 6. Action Items
| 항목 | 담당자 | 기한 | 우선순위 |
|---|---|---|---|
| 알람 임계 조정 | A | 1주 | High |
| Runbook 추가 | B | 2주 | Medium |

## 7. 재발 방지
- {구조적 개선 사항}
Blameless 원칙: "누가 잘못했나" 대신 "어떤 시스템·프로세스가 이 실수를 가능케 했나" — 학습 조직의 핵심.
Session 8 최종 정리 — 오늘 정리한 핵심
5
HA 패턴
N+1·N+M·2N·2N+1·A/A
6
SLA 등급
99~99.9999%
5
클러스터 계층
App·DB·OS·Storage·NW
5
용량 산정 단계
요구→TPS→자원→마진→검증
3
관찰성 축
Metrics·Logs·Traces
5
장애 대응 단계
Detect·Contain·Invest·Recov·Post
12
TA 결정 카탈로그
6
산출물 6대 문서
다섯 축(HA·용량·관찰성·장애·자동화)을 한 묶음의 운영 시스템으로 정리했다.
Session 8 종료
무중단 운영 · 정량 산정 · 관찰성 · 신속 복구 · 자동화
HA · 용량 · 관찰성 · 장애 대응 · IaC/SRE — 다섯 축의 운영 시스템
다섯 축은 따로가 아니라 한 묶음의 운영 시스템. TA의 12 결정 · 6대 산출물이 모두 정리됐다.